

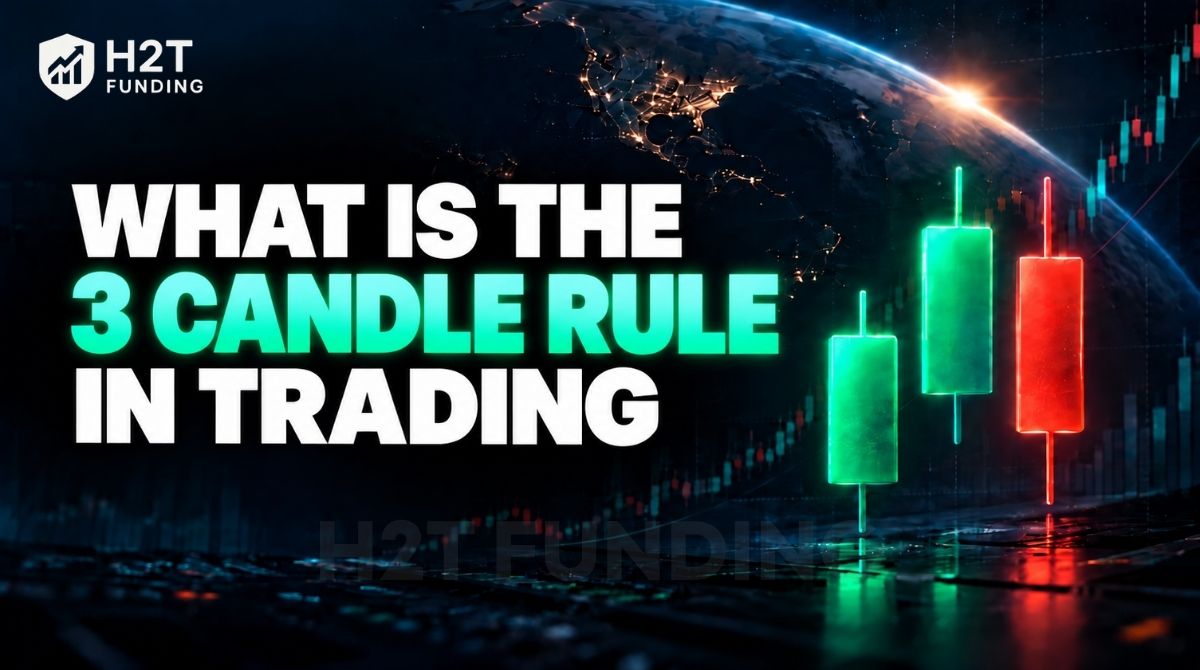
The 3 candle rule in trading is a non-standardized term used for trading approaches that rely on a sequence of three candles to confirm price direction, reversals, or market structure. Depending on the strategy and trading community, it may refer to a three-candle confirmation rule, a three-bar reversal setup, or established three-candlestick patterns.
This guide explains those different meanings, shows how a three-candle sequence works, compares patterns such as Three White Soldiers, Three Black Crows, Morning Star, Evening Star, and Three Inside Up/Down, and then covers identification, trade execution, and risk management.
The comparison below separates these formations by direction, signal type, and trend context before the article explains how traders commonly identify and manage them.
Key taksaways
- No single standardized definition: The “3 candle rule” is an informal label for several three-bar concepts, including confirmation rules, reversal setups, and established three-candlestick patterns.
- Core three-candle patterns: This guide focuses on Three White Soldiers, Three Black Crows, Morning Star, Evening Star, and Three Inside Up/Down, while also distinguishing them from similarly named multi-candle formations.
- Trend signals: These candle sequences can help traders assess whether current momentum is continuing, weakening, or potentially reversing.
- Risk control: Waiting for three-candle confirmation can reduce premature entries and create a clearer execution rule, but it does not eliminate false breakouts.
1. What is the 3 candle rule in trading?
The 3 candle rule in trading generally refers to using a sequence of three candles to confirm a potential reversal, continuation, liquidity sweep, breakout, or other price-action setup before entering a trade. However, the phrase is not a standardized technical analysis term, so its exact rules vary by strategy and trading community.
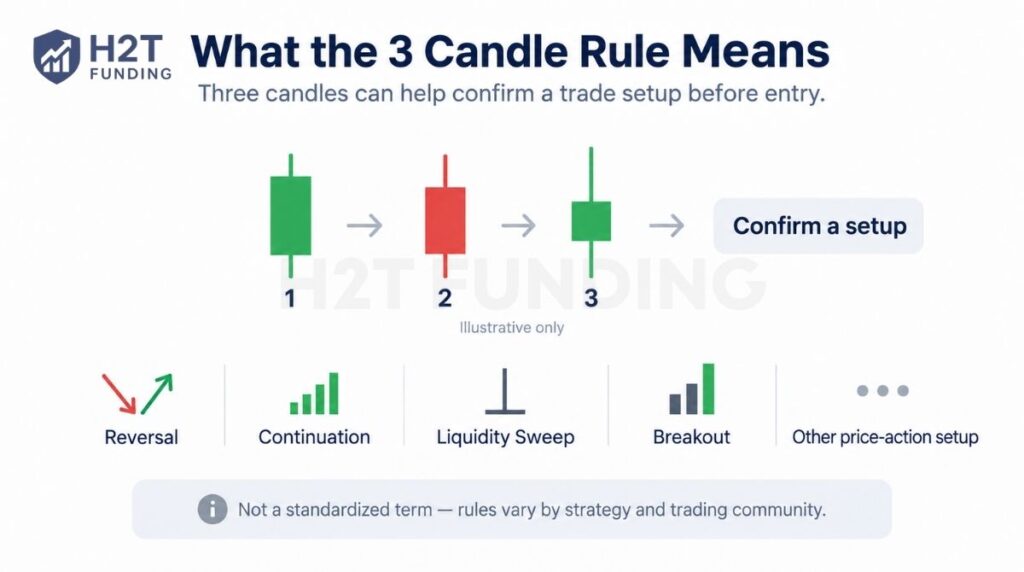
In practice, traders usually use the term in two broad ways: as a three-candle confirmation framework or as an informal label for established three-candlestick patterns.
1.1. Three-candle confirmation setups
Some traders use three candles to confirm a breakout, liquidity sweep, market-structure shift, reversal, or continuation before considering an entry. The exact role of each candle depends on the strategy, so this is a strategy-specific rule rather than a universal standard.
1.2. Three-candlestick patterns
The term is also used for recognized patterns such as Three White Soldiers, Three Black Crows, Morning Star, Evening Star, and Three Inside Up/Down. These patterns have different structures and should not be treated as one standardized “3 candle strategy.”
2. How does the 3-candle rule work?
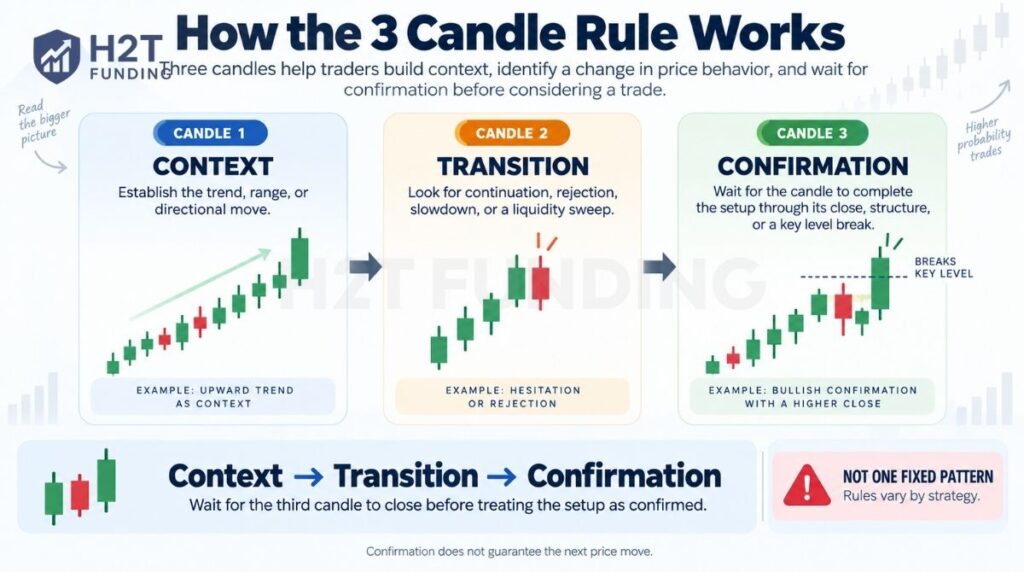
The 3-candle rule works by using three consecutive candles to build context, show a change in price behavior, and provide confirmation before a trader considers an entry. The exact role of each candle depends on the strategy or pattern being used.
- Candle 1 – Context: Establishes the current trend, price range, or directional move that the setup is based on.
- Candle 2 – Transition: Shows whether the original move is continuing, slowing, being rejected, or experiencing a liquidity sweep.
- Candle 3 – Confirmation: Completes the setup by confirming the direction through its close, body structure, or a break of a defined price level.
The third candle does not guarantee the next move. It simply provides additional confirmation based on the rules of the specific setup.
3. Major candlestick patterns associated with the 3 candle rule
The main three-candlestick patterns associated with the 3 candle rule are Morning Star, Evening Star, Three Inside Up/Down, Three White Soldiers, and Three Black Crows. These are reversal formations that use three candles to show a potential shift in market direction.
| Pattern | Signal | Typical Context |
|---|---|---|
| Morning Star | Bullish reversal | After a downtrend |
| Evening Star | Bearish reversal | After an uptrend |
| Three Inside Up | Bullish reversal | After a downtrend |
| Three Inside Down | Bearish reversal | After an uptrend |
| Three White Soldiers | Bullish reversal | After a downtrend |
| Three Black Crows | Bearish reversal | After an uptrend |
- Morning Star and Evening Star use a large trend candle, a smaller middle candle showing indecision, and a third candle that confirms a potential reversal.
- Three Inside Up and Three Inside Down begin with a harami-style structure, where the second candle forms within the first candle’s body and the third candle confirms the move.
- Three White Soldiers and Three Black Crows use three consecutive directional candles that close progressively higher or lower, showing sustained bullish or bearish pressure.
A green candle typically means the price closed above its opening price, while a red candle means the opposite.
Rising and Falling Three Methods are related continuation patterns, but they use five candles rather than three. They are included separately below to avoid confusing them with true three-candle formations.
4. 3 candle rule vs similar multi-candle patterns
The 3 candle rule is a broad confirmation concept, while named multi-candle patterns follow specific candle structures and counts. Similar terminology can be confusing, so traders should identify the actual formation rather than relying on the name alone.
| Term / Pattern | Candles | Typical Role | Key Difference |
|---|---|---|---|
| 3 Candle Rule / Three-Candle Setup | 3 | Confirmation, reversal, or continuation | Uses three candles, but the exact rules depend on the strategy |
| Three Line Strike | 4 | Traditionally classified as continuation | Adds a fourth candle that reverses against the prior three-candle move |
| Rising / Falling Three Methods | 5 | Continuation | Uses one strong trend candle, three smaller counter-trend candles, and a final continuation candle |
The key difference is standardization. A 3 candle rule may be a strategy-specific confirmation framework, while named patterns such as Three Line Strike and Rising or Falling Three Methods have defined candle structures.
If a source uses terms such as “3-Method Formation,” check the candle count and formation rules before assuming it refers to a standard three-candle setup.
5. How to validate a 3-candle pattern on your chart
To validate a 3-candle pattern, first confirm the market context, then compare the three candles with the structure of the specific pattern, and finally check whether the third candle completes the setup.
- Check the prior trend or market context. Reversal patterns are more meaningful after a recognizable uptrend or downtrend, while continuation patterns require an existing trend. Support and resistance can provide additional context.
- Compare the candle structure. Check the body size, wick length, opening and closing position, and how each candle relates to the previous one. The exact structure depends on the pattern, so do not apply one fixed three-candle shape to every setup.
- Confirm the third candle. The third candle should complete the structural requirements of the pattern before you treat the formation as valid. When reliable volume data is available, increased activity can provide additional confirmation.
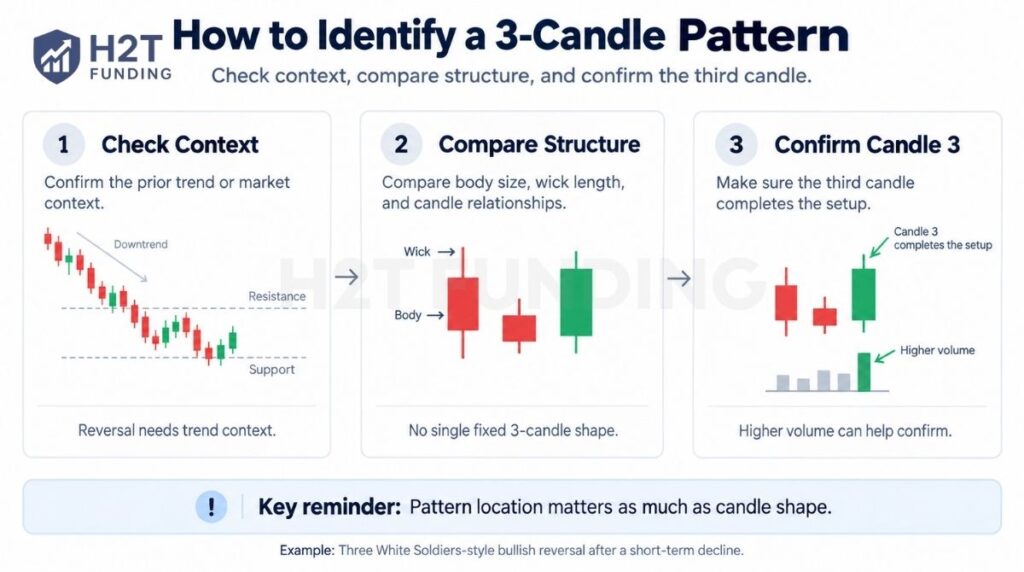
Pattern location matters as much as candle shape. A textbook-looking formation that appears without the required trend context may be less meaningful.
Real Chart Example: This XAU/USD 4-hour chart shows a Three White Soldiers-style bullish reversal forming after a short-term decline. Three consecutive bullish candles close progressively higher, followed by additional upside movement.
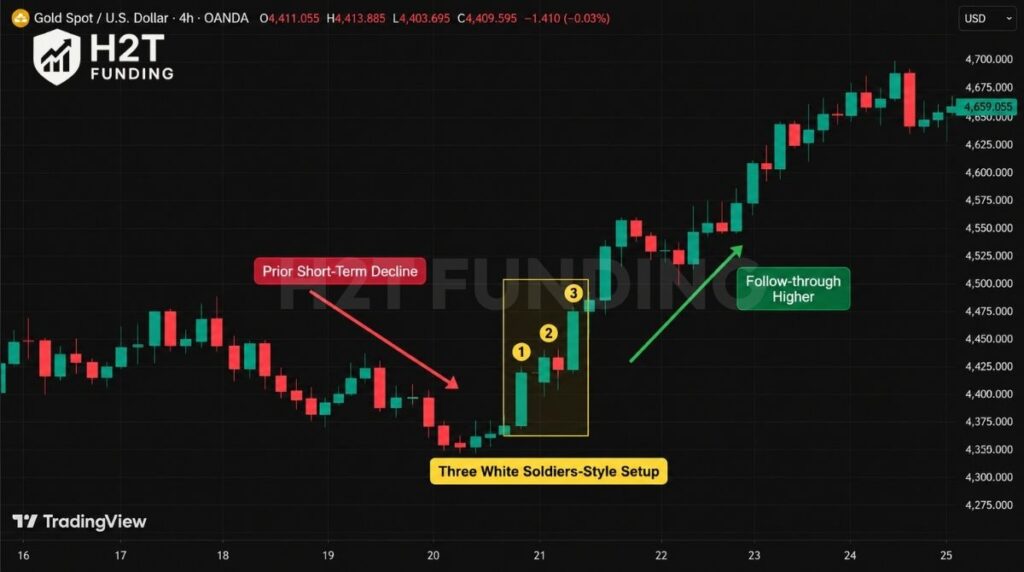
This example is intended for pattern recognition, not as proof that the setup will always produce a profitable trade. Before acting on a similar formation, check the prior trend, candle structure, and any confirmation rules used in your strategy.
6. How to trade 3-candle patterns (entry, stop-loss, take-profit)
A common way to trade a confirmed 3-candle pattern is to wait for the third candle to complete, enter only when the setup meets your strategy rules, place the stop-loss at the pattern’s invalidation level, and set the target using nearby support or resistance or a predefined risk-reward plan.
- Entry: For patterns that use the third candle as confirmation, traders commonly wait for that candle to close before considering a position. Some setups enter on the next candle, while others require a break of a specific price level.
- Stop-Loss: Place the stop where the pattern is no longer valid. For many bullish setups, this may be below the formation low; for bearish setups, it may be above the formation high. The exact level depends on the pattern.
- Take-Profit: Set the target before entry using the next support or resistance area or a risk-reward ratio supported by your tested strategy. A 1:2 risk-reward ratio can be used as an example, but it is not a fixed requirement.
Traders may also combine the setup with tools such as MACD or moving averages to add market context or an additional confirmation condition.
Read more:
7. Which timeframes work best for three-candle setups?
There is no single best timeframe for every three-candle setup. Lower timeframes produce more signals but more short-term noise, while 1-hour, 4-hour, and daily charts usually provide broader trend context with fewer setups.
| Trading Style | Typical Timeframe | Main Trade-Off |
|---|---|---|
| Scalping / Short-Term | 1M–15M | More setups, but greater sensitivity to market noise |
| Intraday / Swing | 1H–4H | Balanced setup frequency and clearer trend context |
| Position Trading | Daily or higher | Fewer setups, but broader market structure |
Choose the timeframe that matches your holding period, market, and tested strategy rather than assuming that a higher timeframe is always better.
Three-candle formations can appear in forex, futures, stocks, and crypto, but market structure differs across assets. Stocks may show session gaps, crypto trades continuously, and forex and futures have distinct liquidity periods, so the same setup should not be assumed to perform identically across every market.
For better context, match the chart timeframe to your intended holding period and consider checking a higher timeframe for the broader trend before acting on a lower-timeframe setup.
8. Risk management and common mistakes
The main risks when trading 3-candle patterns come from oversizing positions, entering before confirmation, ignoring market context, and using stop-loss levels that do not match the setup. A clear risk plan matters more than the pattern itself.
Risk management for 3-candle trades
- Position sizing: Risk only a small portion of account equity on each setup. A common guideline is around 1%–2% per trade, but the appropriate amount depends on your strategy, volatility, and account drawdown limits.
- Stop-loss placement: Place the stop at the level that invalidates the pattern rather than using the same fixed distance for every trade.
- Trade target: Define the target before entry using nearby support or resistance or a risk-reward ratio supported by your tested strategy. A 1:2 ratio can be used as an example, not a universal minimum.
Common mistakes to avoid
- Entering too early: Acting before the third candle closes can leave you trading an incomplete setup.
- Ignoring market context: A reversal pattern without a recognizable prior trend, or a continuation pattern without an existing trend, is harder to interpret.
- Oversizing the trade: A valid-looking pattern can still fail, so position size should reflect the amount you can afford to lose if the stop is hit.
- Treating confirmation as certainty: Three-candle confirmation can add structure to an entry decision, but it does not eliminate false signals or guarantee a profitable move.
No candlestick pattern guarantees a profit. The setup should always fit within your broader risk-management rules before you enter a trade.
9. Applying the 3 candle rule within a prop firm account
A 3-candle setup works the same technically in a prop firm account, but firm-specific daily loss and drawdown rules make position sizing and stop-loss placement more important. The trade should fit inside the account’s remaining risk limits before you enter.
Managing prop firm risk:
- Check the account rules first: Review the firm’s daily loss, maximum drawdown, and any other risk restrictions that apply to your program.
- Size the trade to the stop-loss: Calculate how much account equity would be lost if the setup reaches its invalidation level, then reduce position size if that loss is too large for the remaining risk budget.
- Do not force a valid-looking setup: A technically valid 3-candle pattern can still be unsuitable if the required stop-loss would put the account too close to a loss limit.
- Follow firm-specific trading conditions: If the program has additional restrictions, such as consistency, news-trading, or holding rules, check them separately rather than assuming they apply to every prop firm.
For example, if the account has only 1% of equity left before reaching its daily loss limit and the proposed position would lose 1.5% of equity if the stop-loss is hit, the trade exceeds the available daily risk budget. The trader would need to reduce the position size or skip the setup.
Using a predefined three-candle confirmation condition can help reduce impulsive entries, but it does not guarantee a lower loss rate or protect the account from drawdown.
For broader comparisons, review the risk rules and account structures in our guide to the best prop firms.
10. FAQs
“Three-candlestick rule” is an alternative phrasing for the same broad search concept. “Candlestick” is the more specific charting term for an individual price bar, but the phrase still does not refer to one standardized trading rule.
A bullish three-candle pattern indicates a potential shift toward buying pressure. Common examples covered in this guide are Three White Soldiers, Morning Star, and Three Inside Up.
No. The 3-5-7 rule is a risk-management concept used by some traders and is unrelated to three-candlestick structures. The exact interpretation of the 3%, 5%, and 7% figures varies between sources, so it should not be treated as a standardized trading rule.
Yes. Three-candle formations can appear in forex because candlestick charts represent open, high, low, and close data for each period. Their usefulness still depends on the specific pattern, timeframe, liquidity, and market context.
No single three-candle pattern is universally the most reliable. Pattern performance depends on factors such as prior trend, timeframe, liquidity, confirmation criteria, and the rules used to define a successful trade.
A common risk-management guideline is to risk only a small portion of account equity on one setup, with 1%–2% often used as an example. Your actual risk should reflect the strategy, volatility, and any drawdown or loss limits on the account.
Practice the setups through backtesting or a demo account before applying them to a funded evaluation. Track a meaningful sample of trades, including win rate, average risk-reward, expectancy, and drawdown, and only consider live or funded use when the rules produce repeatable results within your risk limits.
The “3 candle trading strategy” is a broad label for methods that use a three-candle sequence to confirm a setup or generate a trade signal. There is no single entry, stop-loss, or take-profit rule shared by every strategy using this name.
A bearish three-candle pattern is a three-bar formation that shows increasing selling pressure after an uptrend or near an important price area. Common examples include Three Black Crows, Evening Star, and Three Inside Down.
A three-candle reversal pattern is a formation that uses three candlesticks to show that the prior trend may be losing momentum and changing direction. Examples include Morning Star, Evening Star, Three White Soldiers, Three Black Crows, and Three Inside Up/Down.
There is no single standardized ICT pattern called the “3-candle rule.” Some ICT-style setups use three candles around concepts such as liquidity sweeps, displacement, or market-structure shifts, while Power of Three is a broader accumulation – manipulation – distribution framework. These concepts should not be treated as identical to classic three-candlestick patterns.
There is no universally strongest candlestick pattern. Three White Soldiers is widely recognized as a bullish reversal pattern, but its usefulness still depends on where it forms and what happens after confirmation.
11. Conclusion
The 3 candle rule in trading is not one strategy with a fixed set of rules. It is a non-standardized label for several setups that use three candles to evaluate confirmation, reversals, or market structure. The key is to identify the specific setup being traded rather than relying on the “3 candle rule” name alone.
Patterns such as Three White Soldiers, Morning Star, and Three Inside Up have their own structures, while related formations such as Rising Three Methods use more than three candles. In every case, candlestick patterns should be evaluated alongside trend context, an invalidation level, and a defined risk-management plan.
Understanding these three-candle patterns can improve how you interpret price action, but candlestick analysis is only one part of a complete trading process. To build a complete trading system, explore our full library of technical analysis breakdowns in the Trading Guides & Strategies section at H2T Funding today.
Disclaimer: Trading futures, forex, and stocks involves significant risk of loss and is not suitable for every investor. The candlestick patterns and risk management strategies discussed in this article are for educational purposes only and do not constitute financial advice. Always test new strategies on a demo account before risking real capital.