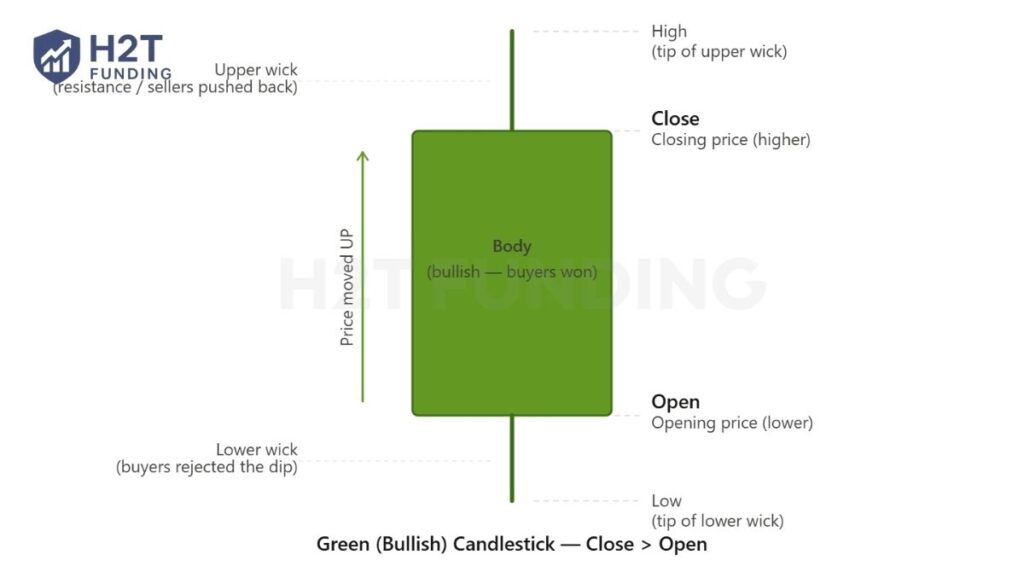
So, what does a green candle mean in financial markets? It simply indicates that an asset closed at a higher price than it opened. This visual cue tells you that buyers dominated the trading session, pushing the market value upward.
However, jumping into a trade just because you see a green bar on the screen is a common trap for beginners. Explore this in-depth guide by H2T Funding to decode bullish chart patterns, avoid market noise, and improve your trading accuracy today.
Key Takeaways:
- Close > Open rule: The core definition showing that buyers successfully pushed the asset’s price higher within a specific timeframe.
- Long body = Strong conviction: A large green body with minimal wicks signals aggressive and sustained buying pressure.
- Volume confirmation requirement: Never trade a bullish setup blindly; high trading volume is required to validate the upward momentum.
- Context over color: Always combine these signals with key support levels or specific formations like the Bullish Engulfing pattern.
1. What does a green candle mean in trading?
Green candle means that an asset’s closing price ended up higher than its opening price within a chosen timeframe. This visual element is the universal symbol of upward momentum, indicating that buyers were actively in control during that session.
Every candlestick tells a story about the constant battle between buyers and sellers. Seeing this specific color confirms that bullish sentiment overpowered any selling pressure, pushing the market value higher.
To fully grasp this concept, you need to recognize its basic anatomy on a price chart:
- The Bottom: Represents the opening price where the trading session began.
- The Top: Shows the closing price, confirming the overall value increase.
The core message reflects market optimism and a strong willingness from traders to acquire the asset.
In short, this upward chart bar is your first immediate clue that an asset is currently experiencing a growth phase. However, a single positive session is just one piece of the puzzle and does not automatically guarantee a permanent uptrend.
2. Anatomy of a bullish candlestick: Body and wicks explained
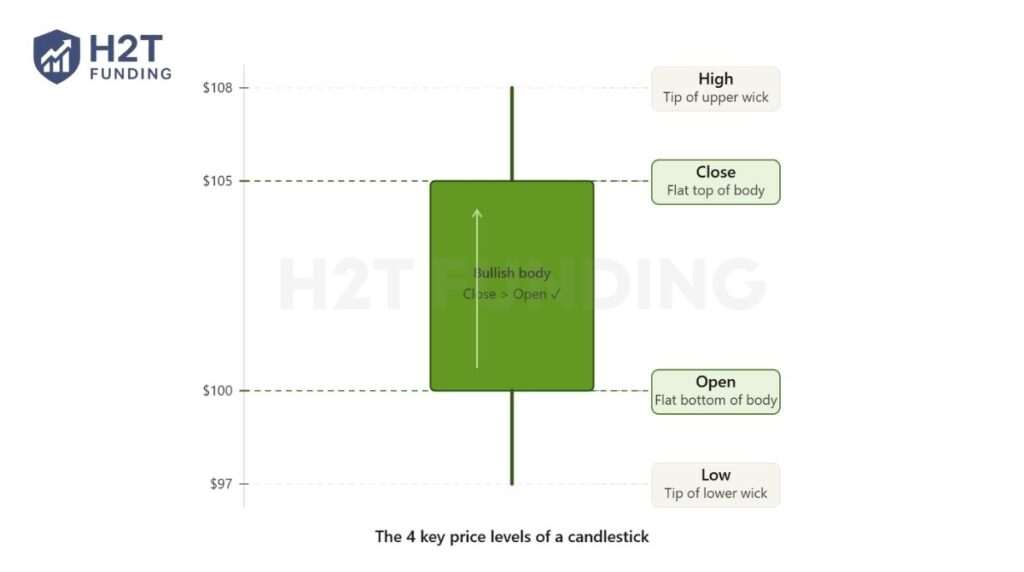
The anatomy of a bullish candlestick consists of a thick rectangular body and thin vertical lines called wicks, revealing the exact price action. To read this visual data accurately, you must understand how these elements interact.
Every single bar on your chart is built using four fundamental data points. Together, they create a complete summary of the market session:
- Open: The flat bottom edge of the solid body, marking where the price started.
- Close: The flat top edge of the body, indicating where the timeframe ended.
- High: The tip of the upper wick, representing the absolute highest traded price.
- Low: The tip of the lower wick, showing the lowest price reached during the period.
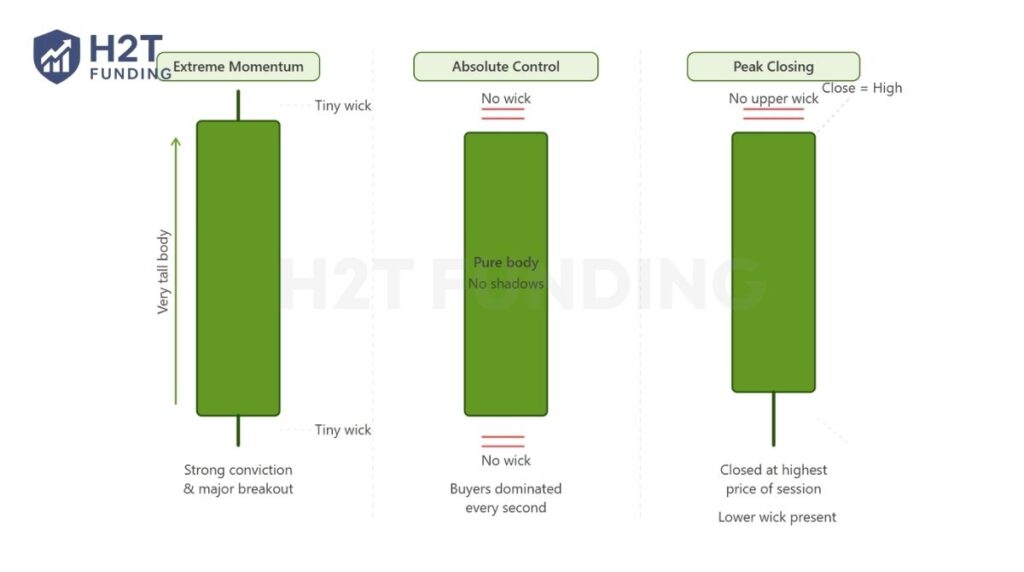
The specific shape of these components tells a much deeper story about market momentum. Here is how to interpret the most important structural variations:
- Extreme momentum: It always signals massive buying pressure. This extended shape generally indicates strong conviction and often initiates a major market breakout.
- Absolute control: To understand what a full green candlestick means, look for a thick block without any shadows. This rare formation proves that buyers dominated continuously from the first second to the last.
- Peak closing: A formation showing no top wick means the asset closed exactly at its highest price. Sellers lacked the strength to push the price down even a single tick before the session finished.
Understanding these structural nuances transforms a simple colored box into a highly detailed market map. The size of the body combined with the length of the wicks will tell you exactly how sustainable the current buying power truly is.
3. How volume validates a green candlestick
Volume validates a green candlestick by confirming that a massive number of trades actually supported the upward price movement. A bullish signal without significant trading activity is highly vulnerable to sudden, unexpected price reversals.
Many beginners make a critical mistake when they completely ignore the bottom volume indicator on their screen. You must always check if the volume bar is noticeably taller than its recent average before trusting the new trend.
To protect your capital, learn to differentiate between a safe entry and dangerous market manipulation:
- Genuine buying: A strong upward price bar perfectly matches a massive volume spike. This proves that large institutional investors are actively participating and driving the market higher.
- The fakeout trap: A sudden price spike might occur on very thin volume. As seen in real-day trading scenarios, massive limit sell orders hidden at the top can instantly crush this fake momentum.
Ultimately, you must consistently verify the trading volume before committing your capital to a new long position. High volume confirms a sustainable trend, while weak market activity serves as a strong warning to step back and wait.
4. Top green candlestick patterns every trader should know
The top green candlestick patterns every trader should know are specific visual formations that strongly predict an upcoming upward price trend. By combining a single bar with the surrounding market context, you can easily identify high-probability entry points.
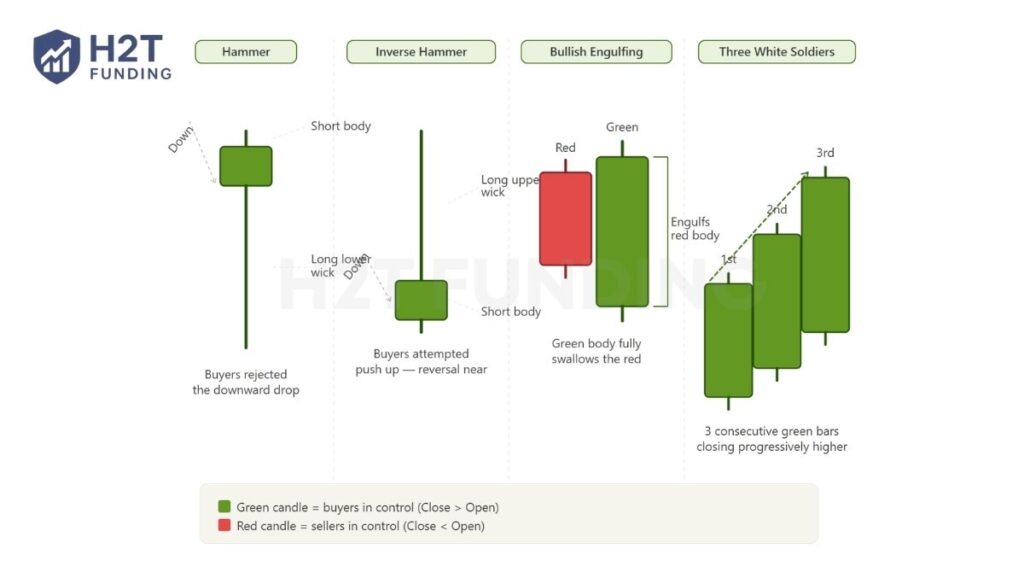
Here are the most reliable bullish formations you will frequently encounter on your charts:
- Hammer: Wondering exactly what a green hammer candlestick means? It features a short body with a long lower wick, signaling that strong buying pressure successfully rejected a downward price drop.
- Inverse Hammer: So, what does a green inverted hammer candle mean for your overall strategy? Occurring after a downtrend, its long upper wick shows buyers attempted to push prices up, indicating a potential market reversal is near.
- Bullish Engulfing: This powerful two-stick setup features a large positive body that completely swallows the previous day’s red body. It clearly represents a massive shift where buyers completely overwhelm the sellers.
- Three White Soldiers: This formation features three consecutive long-bodied positive bars with small wicks progressively closing higher. It provides textbook confirmation of a sustained and powerful bullish momentum taking over the session.
Memorizing these fundamental structural formations allows you to anticipate market moves rather than just reacting to them blindly. Combining these specific patterns with volume analysis drastically increases your overall trading success rate and limits unnecessary risks.
5. Red vs. Green Candle Meaning in Trading
The primary difference between a red candle vs green candle simply comes down to whether the final closing price ended lower or higher than the initial opening price.
Understanding exactly what the red and green mean in trading is absolutely essential for reading the overall market flow. These two opposing colors visually display the endless battle between active buyers and sellers on your screen. When you observe a chart, you are essentially watching a live record of shifting supply and demand.
To make things easy to digest, here is a quick breakdown of how these two indicators compare:
| Feature | Green Candle | Red Candle |
|---|---|---|
| Price Action | Closes strictly higher than the open | Closes strictly lower than the open |
| Market Control | Buyers (Bulls) completely dominate | Sellers (Bears) take full control |
| Sentiment | Reflects optimism and upward growth | Shows pessimism and falling value |
From my personal trading experience, you should never view these two colors as completely isolated events. A sudden red bar appearing during a massive upward trend is often just a temporary pullback, not necessarily an immediate signal to panic and sell everything.
6. Trading Strategies: When to Buy After a Green Candle
You should buy after a green candle only when the signal is validated by a confirmed breakout or a strategic pullback entry. Jumping in immediately just because you see an upward bar often triggers the dangerous fear of missing out (FOMO). However, trading solely on momentum without checking the broader market context usually leads to buying at the absolute peak.
To trade safely like a professional, combine that initial bullish signal with these proven technical strategies:
- Breakout confirmation: Wait for the price to close completely above a major resistance level. A solid close above this line is a much stronger indicator than just a quick wick touching it.
- Pullback entry: In an established uptrend, patiently wait for a temporary downward correction. You can safely enter when a fresh positive bar closes above the previous downward bar’s high.
- Strict risk management: Always place a stop-loss order immediately below your entry setup. This acts as a safety net to protect your capital if the market suddenly reverses.
Patiently waiting for these specific confirmations helps you filter out dangerous market noise and institutional traps. Applying strict risk controls on every single position is what ultimately keeps your trading account consistently safe over the long term.
Read more:
7. FAQs (Frequently Asked Questions)
The core meaning is identical across both markets, indicating that buyers successfully pushed the asset’s price higher. Whether you trade traditional equities or digital assets, this visual bar always represents positive upward momentum. However, cryptocurrency charts typically experience significantly higher volatility and sharper price swings compared to traditional markets.
It generally acts as a clear buy signal, representing active upward market momentum. However, you should never execute a new trade based entirely on a single isolated bar. Always look for volume confirmation or key support zones before risking your capital on a new position.
A long upper wick shows that prices climbed rapidly but were strongly pushed back down before the session officially closed. This structural detail indicates that buyer strength was ultimately insufficient to maintain the high price. It reflects strong market resistance and often hints at a potential upcoming price correction.
This specific pattern serves as a hidden bearish warning sign despite its seemingly positive color. Featuring a small body at the bottom and a very long upper shadow, it clearly reveals that the bulls are quickly losing their power. Sellers are actively stepping in to reject the higher prices.
It simply indicates that the asset’s final closing price fell strictly lower than its initial opening price. This downward visual movement shows that sellers dominated that specific trading session. It is the exact opposite of bullish momentum, highlighting either a temporary pullback or a long-term drop in market value.
Three consecutive positive bars are widely considered the standard technical threshold to confirm a brand new uptrend. This specific reliable sequence is known as the Three White Soldiers. It provides technical traders with strong structural evidence of sustained and powerful buying momentum over multiple trading sessions.
This sudden price drop is often the direct result of a liquidity grab orchestrated by large institutional traders. As noted by experienced day traders, massive limit sell orders are strategically placed at the top to trap emotional retail buyers. This organized fakeout quickly crushes the artificial upward momentum.
In spiritual practices, it is traditionally used during manifestation to attract wealth, financial prosperity, and deep emotional healing. Many individuals use these items for specific meditation routines or personal intention setting. However, in financial markets, this colored bar is entirely focused on representing pure price data and shifting trader psychology.
8. Conclusion
Understanding exactly what does a green candle mean is merely your first step toward mastering technical chart analysis. While this visual indicator clearly shows that buyers temporarily control the market, it should never be your only decision-making tool. You must consistently confirm these bullish setups with strong trading volume and a broader market context to avoid institutional traps.
Now that you know how to read these essential price signals, it is time to apply this knowledge to live charts. Enhance your technical edge by exploring more expert guides in the Trading Guides & Strategies category at H2T Funding. Equip yourself with our proven market tactics, pass your funding challenges, and start building sustainable wealth today!
Disclaimer: Trading financial markets involves significant risk and may not be suitable for all investors. Always apply strict risk management and verify current market conditions before executing any trades.