An overlay chart is a technical analysis method that places the price data of multiple assets onto the exact same visual graph. Wondering how to overlay charts on TradingView? Simply click the Compare [+] button on your top toolbar and type a second ticker symbol. This action instantly superimposes the new asset directly over your main price view for quick correlation analysis.
Keep reading this guide by H2T Funding to learn the exact steps for fixing squished price scales, utilizing advanced indicator scripts, and setting up split-screen layouts for your workspace!
Key takeaways
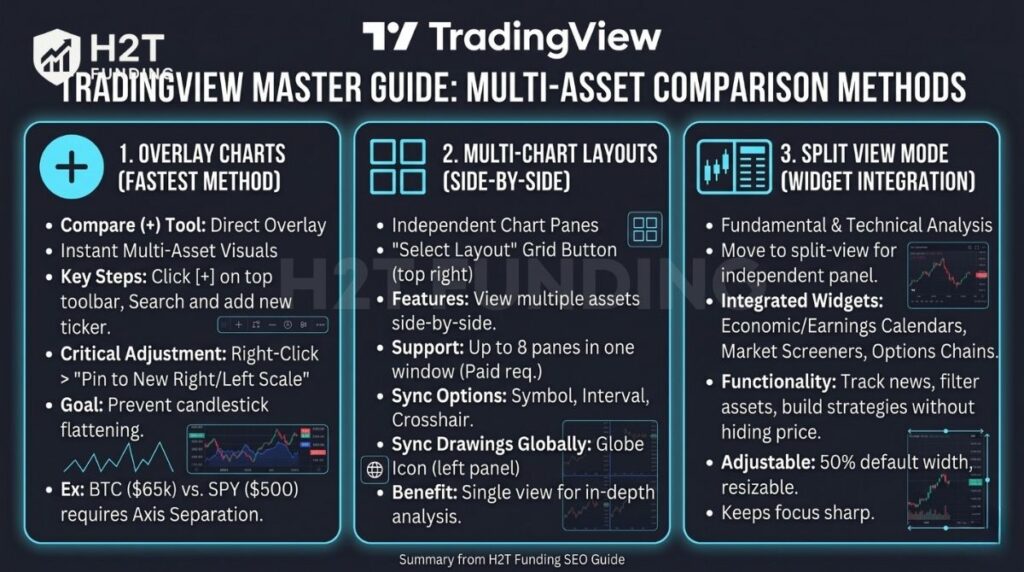
- [+] Compare Tool (Fastest): Click the plus icon on the top toolbar to instantly plot a new ticker symbol over your primary price action.
- Price Scale Separation: Right-click the newly added asset and select “Pin to New Right/Left Scale” to prevent candlestick flattening.
- Split-Screen Layouts (Up to 8 panes): Use the “Select Layout” grid button to view multiple assets side-by-side (Requires paid subscription).
- Global Drawing Sync: Click the globe icon on the left panel to automatically replicate your trendlines across different timeframes for the same ticker.
1. How to overlay charts on TradingView (The fastest method)
The fastest way to add a second asset to your current view is by using the dedicated Compare button. This built-in tool instantly puts two different data sets on the exact same canvas. Learning how to overlay two charts on TradingView properly starts with mastering this basic function.
1.1. Step-by-step guide to the compare tool
Adding a secondary asset is a straightforward process. Follow these 3 exact steps to combine your market data efficiently.
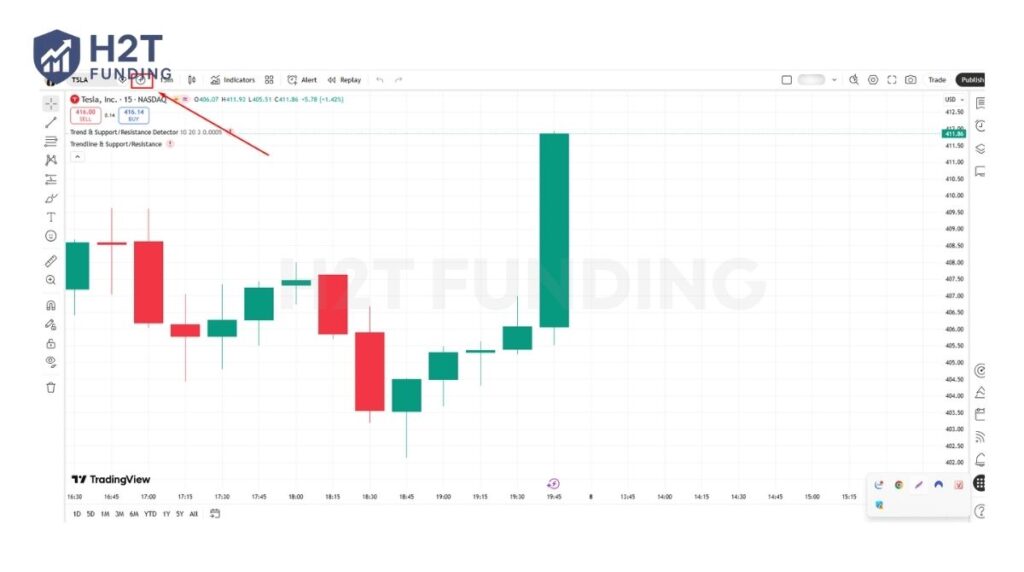
Step 1: Open your primary chart. Load up the base symbol you want to analyze first. This establishes your primary reference point for the entire analysis.
Step 2: Locate the Add Symbol tool. Look at your top toolbar for a circle containing a plus sign [+]. Clicking this icon opens the search menu for new tickers. Alternatively, you can right-click directly on the main canvas and select the add symbol option.
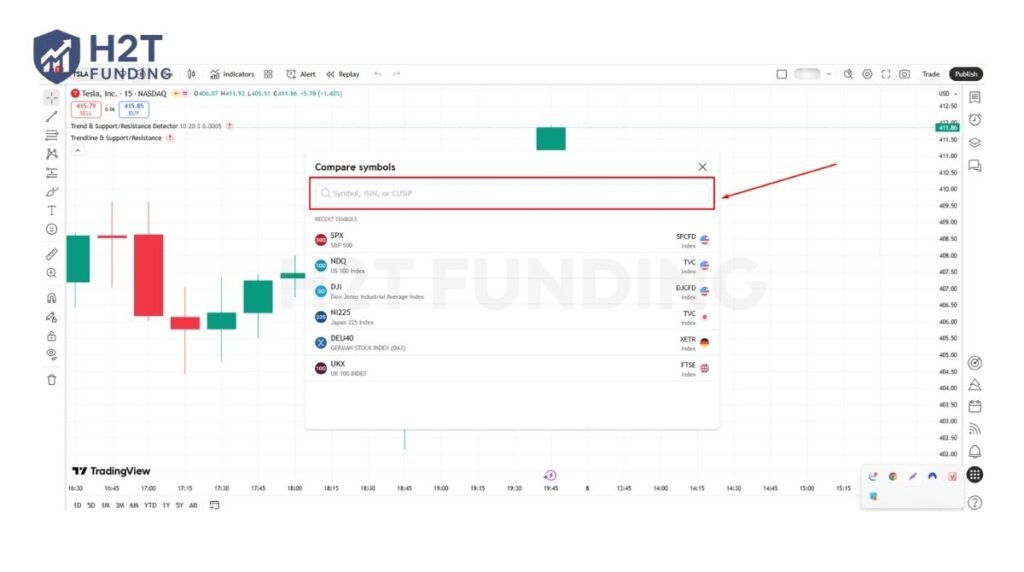
Step 3: Search and select the ticker. Type the name of the second asset in the search bar. Once you click the appropriate ticker, the new data line will appear immediately over your original price action.
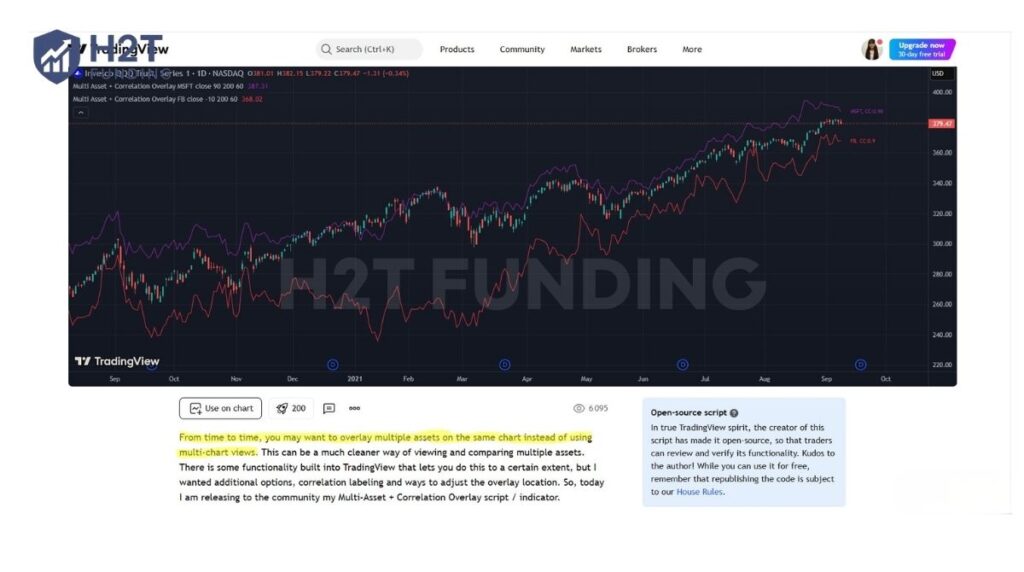
“From time to time, you may want to overlay multiple assets on the same chart instead of using multi-chart views. This can be a much cleaner way of viewing and comparing multiple assets.” -TradingView Community Insights
Once the second asset is plotted, you can instantly analyze how both markets move in relation to one another. Customizing the visual style to a line or candlestick format helps you quickly identify hidden divergences on a single screen.
1.2. Managing price scales for clear visualization
When comparing assets with vastly different values, your original candlestick data might shrink and look completely flat. Fixing this visual distortion requires separating the price axes. If you do not adjust this setting, the overlay becomes very difficult to read accurately.
To correct the view, simply right-click the new data line you just added to the screen. Scroll through the menu and select either the Pin to New Right Scale or Pin to Left Scale option. This specific action gives the second asset its own independent mathematical axis.
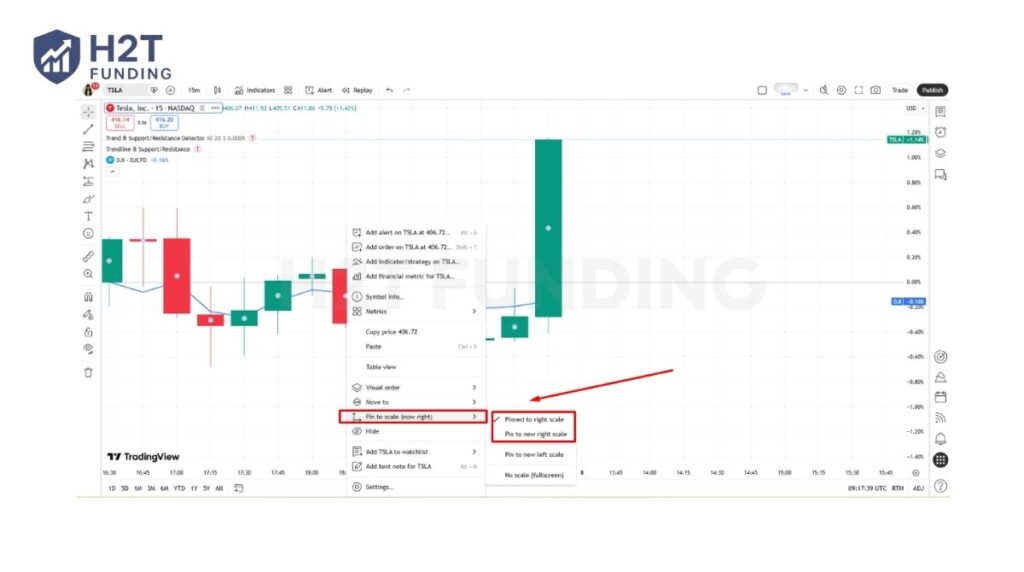
Real trading example: If you overlay Bitcoin (priced around $65,000) onto the S&P 500 ETF (SPY, priced around $500), the massive price difference will compress the SPY candles into a flat, unreadable line. Pinning Bitcoin to a “New Right Scale” separates their math, allowing you to see both trends clearly.
As a result, both visual trends will display clearly without squishing each other. You can also temporarily hide this comparison line by clicking the eye icon in the indicator legend on the top left.
By utilizing the built-in compare function and separating the price axes, traders can easily spot market correlations. This fundamental technique saves valuable time and keeps your workspace strictly organized while analyzing multiple financial instruments.
2. Advanced multi-asset overlays using technical indicators
For deeper analysis, you can use custom technical scripts to project complex market data directly onto your screen. Knowing how to overlay indicators in TradingView expands your charting capabilities far beyond the basic comparison tool.
2.1. Multi-Asset & Correlation Overlay Scripts
Sometimes, default settings do not align perfectly when you analyze two drastically different markets. Custom community scripts allow you to fine-tune these visualizations and see mathematical relationships that the standard tool doesn’t show.
Follow these 3 simple steps to apply this advanced correlation tool:
Step 1: Open the Indicators menu. Click the “Indicators” button on your top toolbar or press Alt+I on your keyboard.
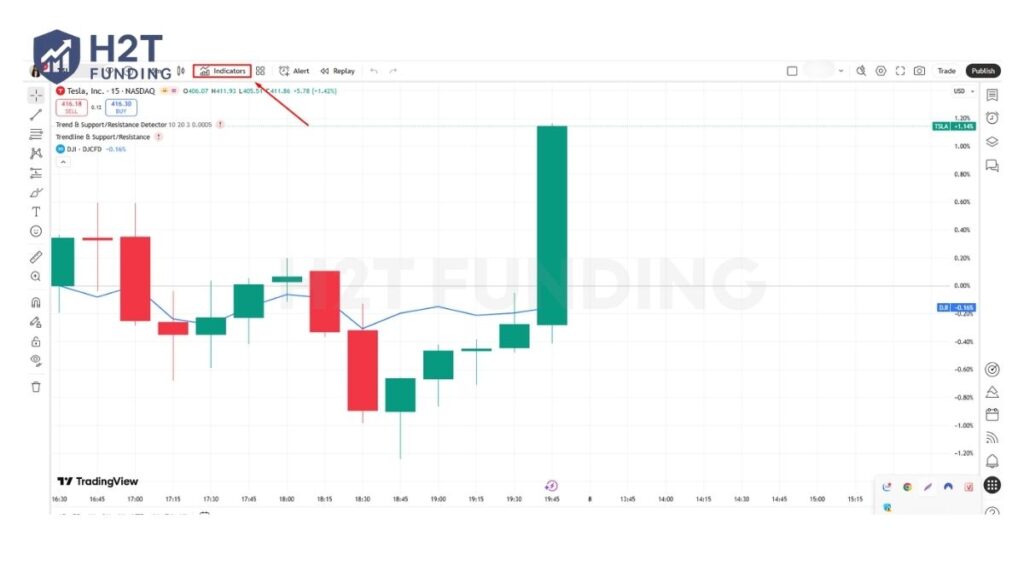
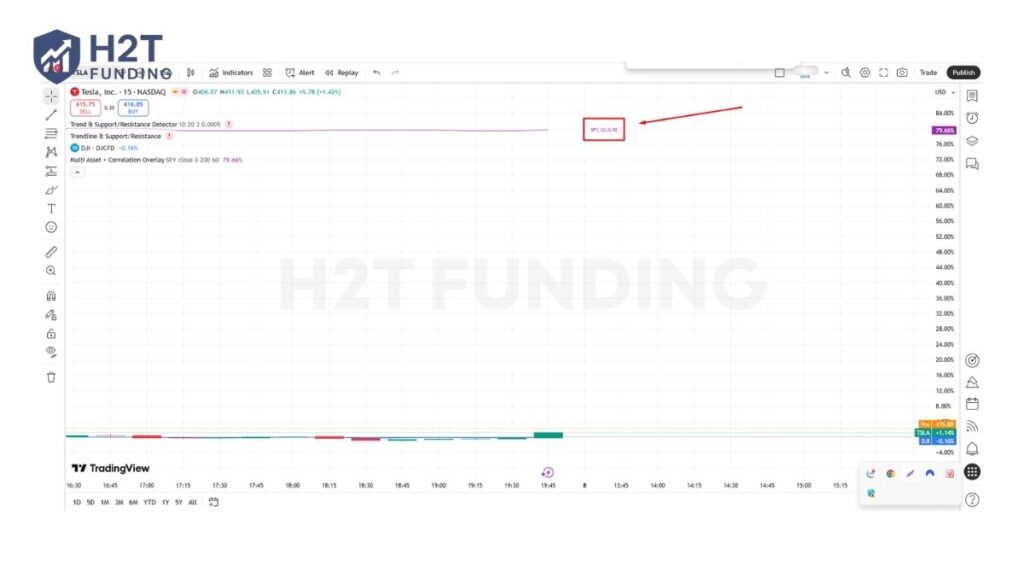
Step 2: Search for the script. Type “Multi Asset + Correlation Overlay” in the search bar and select the version by TradeAutomation from the Community list.
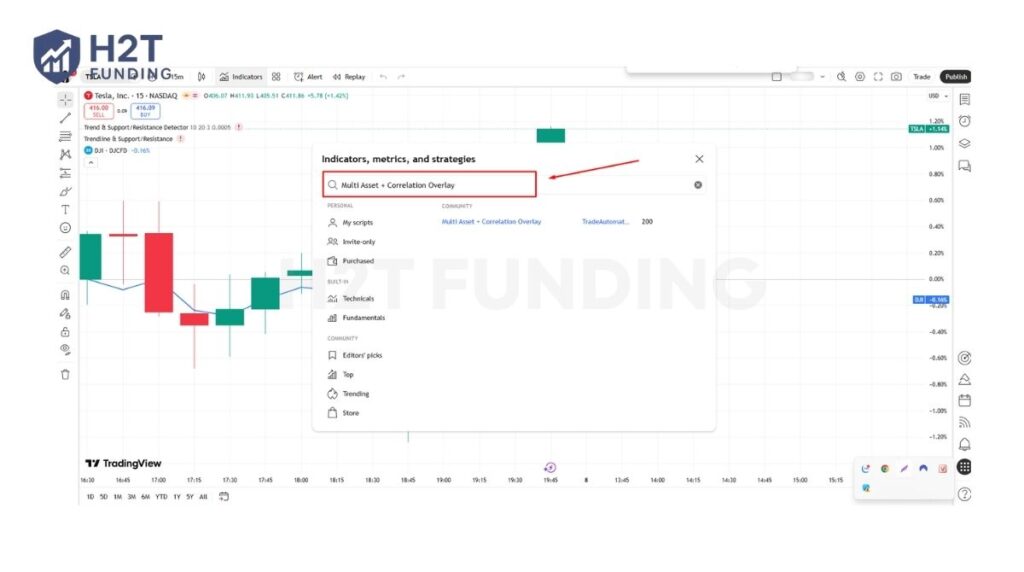
Step 3: View the real-time correlation. Once added, the script automatically calculates how the assets move together.
Real-World Example: As seen in the screenshot, when overlaying the S&P 500 ETF (SPY) onto Tesla (TSLA), the script displays “CC: 0.92” next to the price line. This high coefficient confirms a very strong positive correlation, meaning both assets moved almost identically during that specific period.
You can also open the indicator settings to adjust offset parameters if the price lines overlap too much. This specific adjustment pulls the line up or down for perfect visual alignment without changing the underlying percentage data.
2.2. Time-shift analysis with lagged overlays
Another powerful method involves shifting historical price data to discover leading or lagging market behaviors. By applying the Asset Overlay with Lag [CubeT] indicator, you can delay the secondary asset’s data by a specific number of bars. This is perfect for traders trying to compare time-shifted movements across different market cycles.
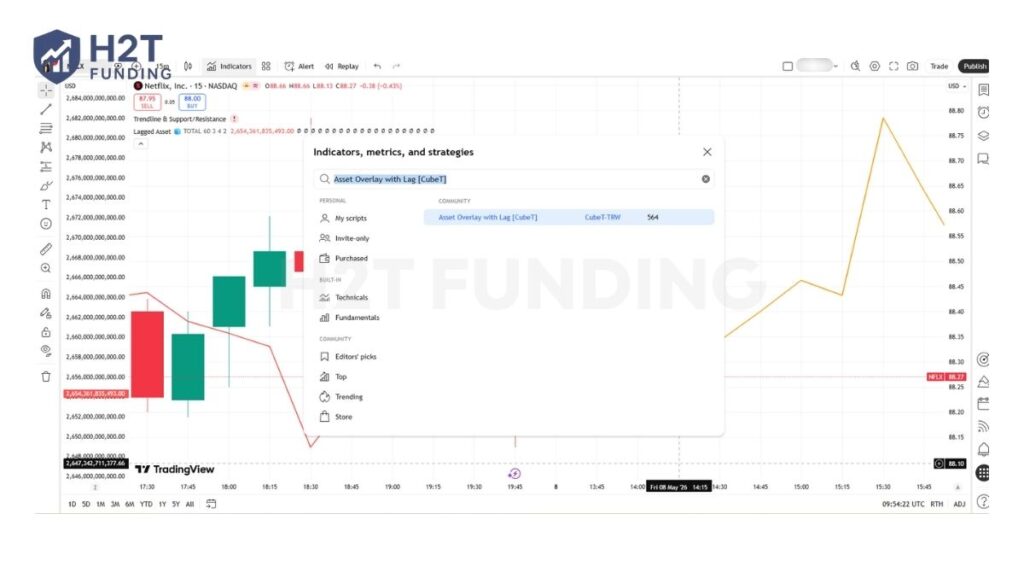
This tool also features a Continuum Mode for advanced visual projections. You can display up to 21 historical continuation lines around your base lag. Just remember to keep all projected lines under the 500-day limit, or the visual plots will not render accurately on your interface. If you ever wondered how to overlay another chart on TradingView with time delays, this is your answer.
Utilizing custom scripts provides precise control over price offsets, correlation math, and time-shifted data. These advanced techniques transform a standard workspace into a highly detailed analytical environment for any serious trader.
Read more:
3. Comparing assets side-by-side using multi-chart layouts
To view markets side-by-side instead of layered on top of each other, you must activate the multi-chart layout feature. This splits your workspace into a grid so you can monitor multiple price actions without cluttering a single pane.
3.1. How to enable split-screen views on SuperCharts
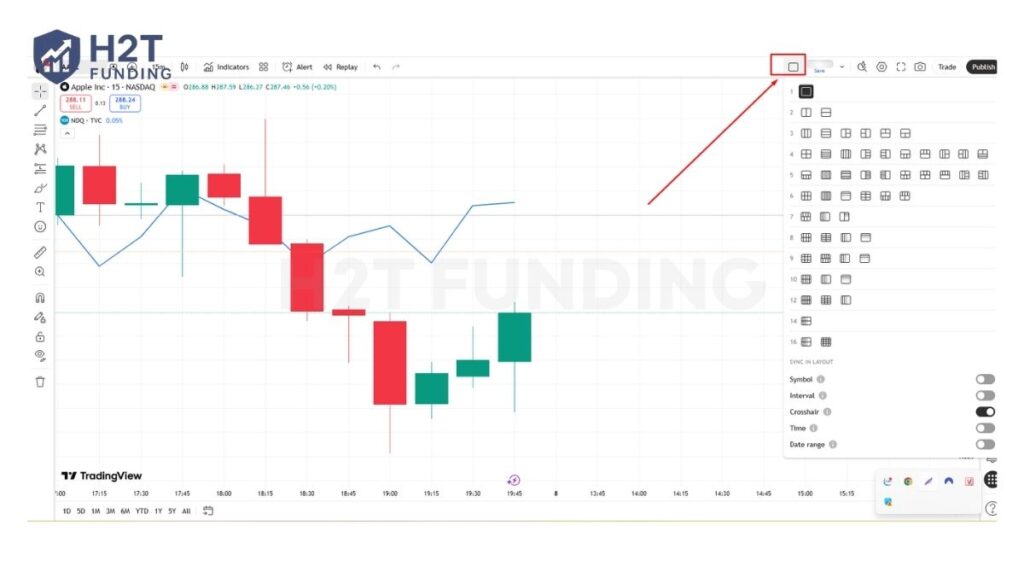
If you are wondering how to have two charts on TradingView simultaneously, start by clicking the grid-shaped “Select Layout” button at the top right. This menu lets you divide your screen into various configurations, supporting up to 8 different panes in a single window.
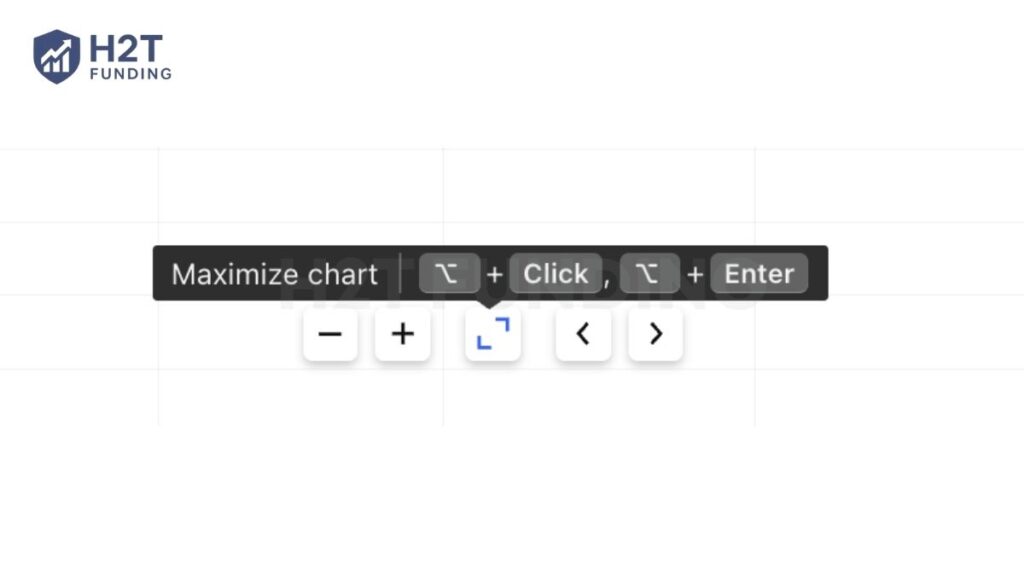
Every individual pane has its own scroll and zoom controls. To enlarge one specific pane temporarily, just press Alt+Enter or Alt+Click directly on it. You can also press Tab to quickly switch your active selection between the different grids.
3.2. Synchronizing symbols, intervals, and crosshairs
When using multiple panes, you might want them to track the exact same data points. You can easily link them using the “Sync in Layout” options located right under your layout selector. Toggling these buttons ensures your crosshair, date range, or timeframe moves identically across all visible grids.
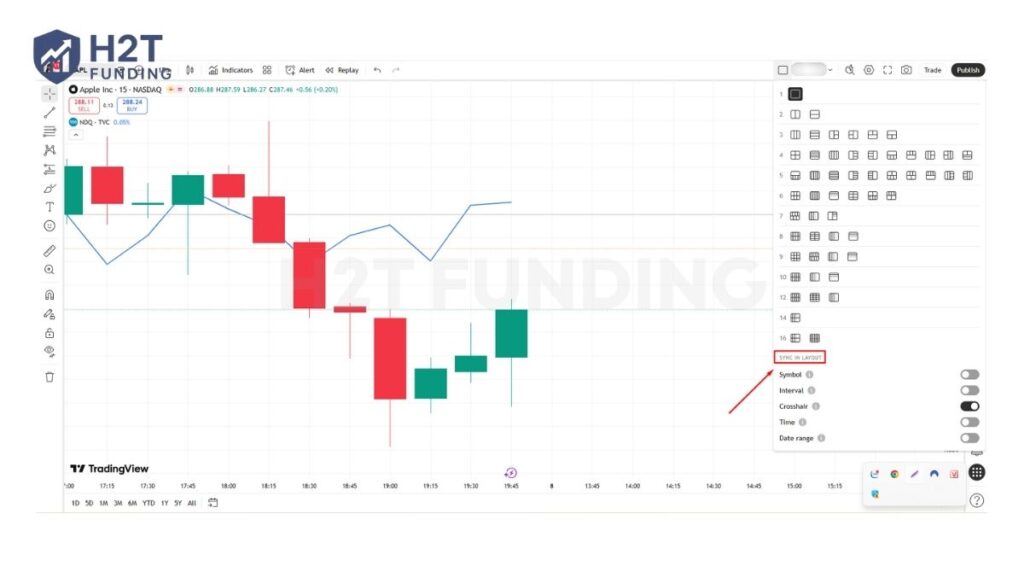
For more precise control, use the chart syncing feature located in the status line of each pane. By assigning the same emoji icon to specific charts, you group them together. This ensures symbol and interval changes only affect that specific tied group.
3.3. How to sync drawings globally across layouts
By default, your technical lines only apply to the specific layout and symbol you are currently editing. To prevent repeating your work, look at your left-hand drawing panel and click the globe icon. Selecting the “New drawings will sync globally” option guarantees your lines automatically replicate across all saved layouts.
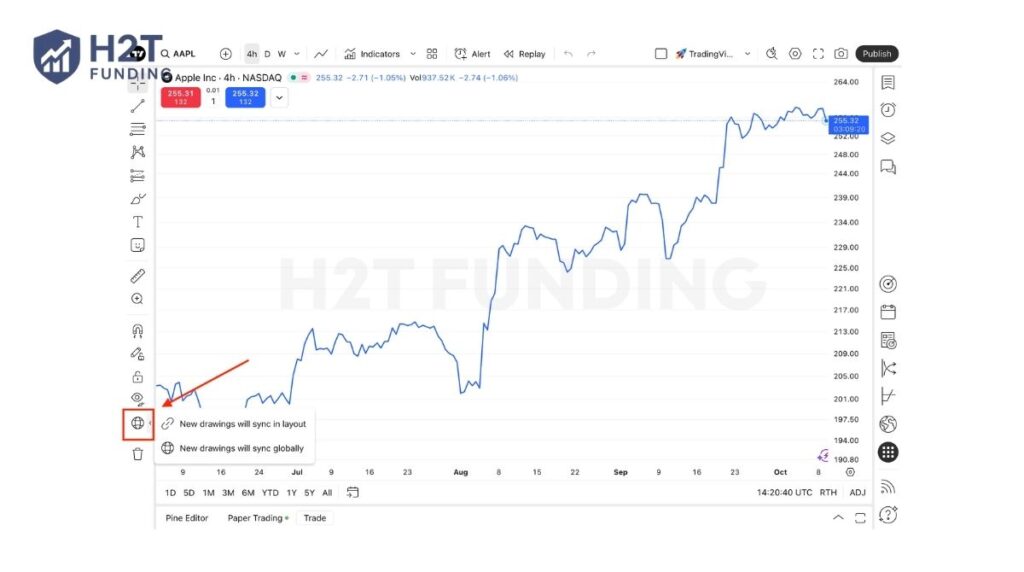
Keep in mind that this synchronization is strictly tied to the exact ticker symbol. If you draw a trendline on a Gold chart, it will not transfer over to an Apple chart. If you switch to a different asset, your previous graphics temporarily disappear until you return to the original ticker.
Mastering these grid layouts and synchronization settings eliminates the need for multiple browser tabs. Your analytical process becomes much faster and far more organized when all crucial market data is perfectly linked.
4. Streamlining workspaces with TradingView split view mode
To view widgets like screeners or calendars without covering your price scale, click the “Move overlay to split-view” button located at the top right of the active panel. This unique feature allows you to analyze fundamental data alongside your technical charts.
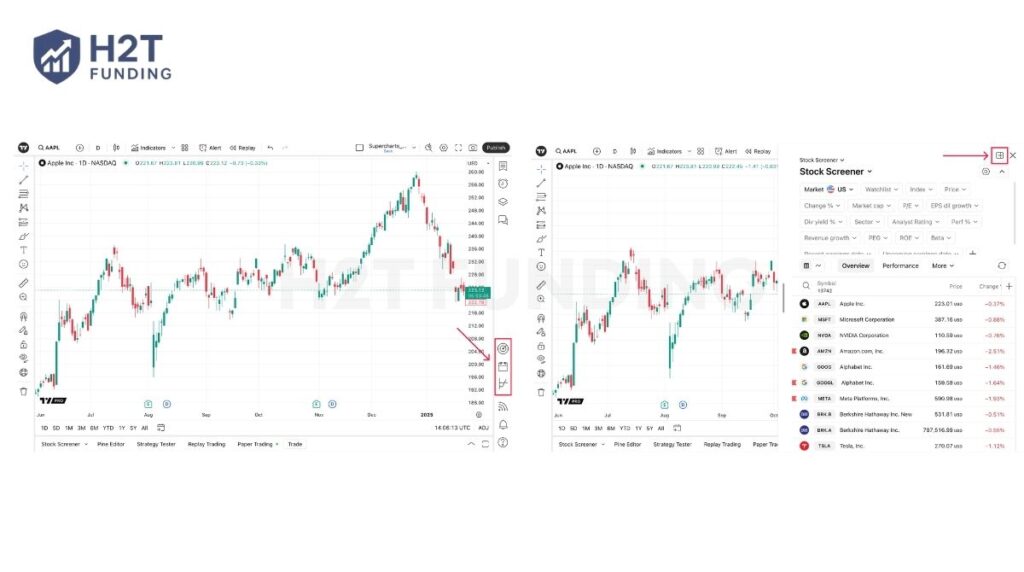
When you normally open a widget from the right toolbar, it often blocks crucial information. You temporarily lose sight of your watchlist, alerts, and price axis. The split-view function solves this problem entirely on Supercharts. By activating it, you create a completely independent viewing area.
Here are 3 key widgets you can display side-by-side with your main graphic:
- Economic and Earnings Calendars: Watch price action unfold while tracking upcoming news events, revenue, or dividend releases.
- Market Screeners: Filter through assets and click any symbol in the list to instantly update your main chart on the left.
- Options Chains: Analyze the strategy builder and volatility tools right next to the underlying asset’s real-time price data.
By default, the separated panel takes up 50% of your screen size. However, you can easily drag the middle border to resize the windows according to your needs. The platform also remembers your exact size preferences and widget order for your next login session.
Quick Reference: TradingView Overlay Keyboard Shortcuts
| Shortcut | Action | Where to Use |
|---|---|---|
| Alt + I | Open Indicators & Strategies menu | Any chart view |
| Alt + Enter | Maximize/restore a single pane in multi-chart layout | Multi-chart layouts only |
| Alt + Click | Expand a specific pane temporarily | Multi-chart layouts only |
| Tab | Switch active selection between chart panes | Multi-chart layouts only |
| Right-click → Pin to Scale | Separate price axes for overlaid assets | After adding a compare symbol |
Summary Recommendation: Which Charting Method Should You Choose?
| Method | Best For | Free Plan? | Max Assets |
|---|---|---|---|
| Compare [+] Tool | Quick 2-asset correlation on one chart (e.g., Gold vs. USD) | ✅ Yes | Multiple overlays |
| Indicator Overlay Scripts | Correlation math, time-shifted analysis, CC coefficient | ✅ Yes | Depends on script |
| Multi-Chart Layouts | Side-by-side multi-timeframe analysis (5m vs. Daily) | ❌ Paid only | Up to 8 panes |
| Split View Mode | Trading news + watching live price action simultaneously | ❌ Paid only | Chart + 1 widget |
5. FAQs
To figure out how to overlay 2 charts on TradingView, simply click the Compare [+] button on your top toolbar. Next, type the ticker symbol for your secondary asset and select it from the list. This action immediately places the new data over your primary price action for quick visual comparison.
You add these tools by clicking the Indicators & Strategies button or pressing Alt+I on your keyboard. From there, search for specific community scripts like the “Multi Asset + Correlation” tool. Once applied, open the indicator settings to assign your target ticker and adjust the visual offset to fit your screen.
To view different graphical formats simultaneously, you must use the Select Layout grid feature to split your workspace. After dividing your screen into multiple panes, click on one specific window to change its display style to a line or bar, while keeping the other pane as standard candlesticks.
Free accounts are restricted to a single pane per tab and cannot use the built-in Select Layout grids. However, a practical workaround is to open a completely new browser tab with your second asset. You can then manually resize both browser windows side-by-side on your computer monitor to recreate the premium multi-pane experience.
6. Conclusion
Learning exactly how to overlay charts on TradingView is a massive advantage for your daily technical analysis. This simple technique helps you compare market trends, spot hidden divergences, and make smarter trading decisions with absolute confidence. Whether you use the direct compare tool or split your screen, an organized workspace keeps your focus incredibly sharp.
Are you ready to pass your next evaluation and scale your trading capital? Explore H2T Funding’s dedicated Guides category today to master your trading tools and achieve long-term funded trading success!
Disclaimer: TradingView features, subscription plans, and available tools are subject to change. Always verify the current platform capabilities and pricing directly on the official TradingView website. The information provided is for educational purposes and does not constitute financial advice.