What is a good Sortino ratio? A good Sortino ratio is typically 1.0 or higher, while any score above 2.0 is considered exceptional for professional trading strategies. This metric is a core benchmark to help traders identify if their returns are high enough to justify the “bad” volatility or potential losses they face.
By focusing strictly on downside deviation rather than total volatility, this metric provides a realistic view of your performance. Let’s join H2T Funding to break down these essential benchmarks and secure your funded trading success.
Key takeaways
- 2.0+ Ratio (Very Good to Excellent): The gold standard; it indicates high returns with very low “harmful” volatility, ideal for attracting serious investment.
- 1.0 – 2.0 Ratio (Good): A solid, acceptable range showing that your strategy earns enough to justify its negative price swings.
- Downside Deviation Focus: Unlike other metrics, the Sortino ratio only penalizes bad volatility, making it perfect for asymmetric trading styles.
- Under 1.0 (Suboptimal): Suggests the returns are not sufficiently high relative to the risk of loss; a common red flag for risk managers.
- Capital Preservation: Maintaining a high ratio is a core requirement for passing the challenges of prop firms and managing large-scale capital.
1. What is the Sortino ratio?
To define what is Sortino ratio in finance, it is a metric that measures your investment’s profit relative to the risk of losing money. It only considers “bad” downside volatility, completely ignoring the positive price gains that traders actually desire.

What is the Sortino ratio used for?
The primary answer to what is Sortino ratio used for is capital protection. It serves as a filter to separate genuine trading skill from reckless luck. By punishing strategies that experience frequent or large price drops, it helps you identify which systems are truly sustainable over time.
While the math is identical, its application varies across different markets:
- In the stock market, when looking at what is Sortino ratio in investing, analysts use it to find stable mutual funds. They want to avoid portfolios that are prone to crashing during market corrections, even if they show high overall growth.
- In Forex trading, this ratio directly measures a system’s survival against sudden drawdowns. High leverage often masks dangerous risks behind big profits. This metric confirms that a strategy can handle account-killing swings while still catching profitable short-term trends.
Whether you are holding long-term equities or scalping currency pairs, this metric acts as a shield for your capital. It strips away the illusion of beneficial volatility to reveal the actual cost of chasing aggressive market returns.
2. What is a good Sortino ratio?
A score of 1.0 or higher is considered good, while anything above 2.0 is considered excellent for evaluating risk-adjusted performance. Professional analysts use these benchmarks to determine if a strategy earns enough profit for every unit of bad risk it takes on.
| Ratio Value | Interpretation | Professional Rating |
|---|---|---|
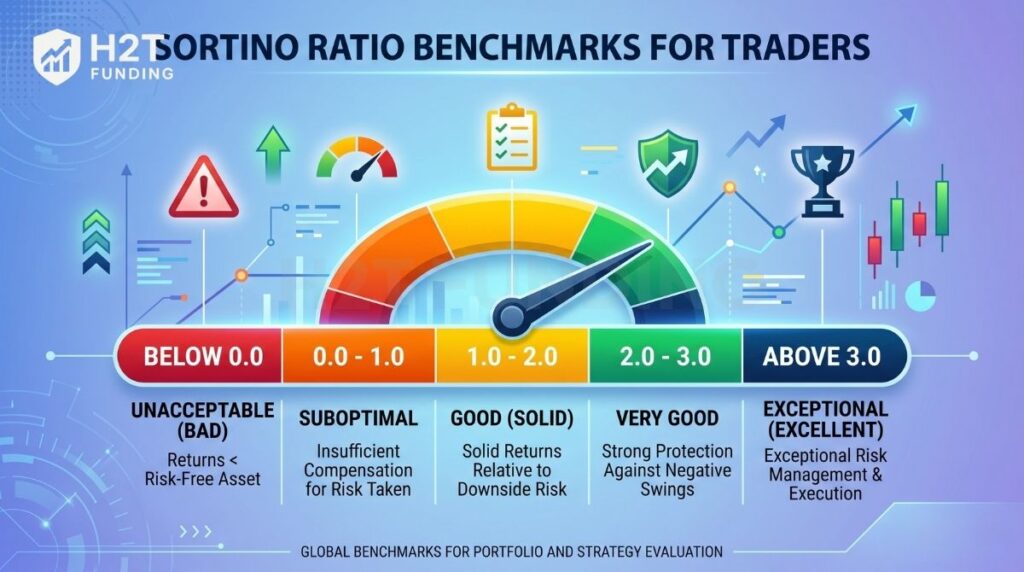
| Below 0.0 | Returns are lower than a risk-free asset | Unacceptable |
| 0.0 – 1.0 | Suboptimal compensation for the risk taken | Suboptimal |
| 1.0 – 2.0 | Solid returns relative to downside risk | Good |
| Above 2.0 | Strong protection against negative swings | Very Good |
| Above 3.0 | Exceptional risk management and execution | Excellent |
When evaluating what is a good Sortino ratio for a portfolio is, institutional investors usually aim for a minimum of 1.5. This ensures the collection of assets is efficiently allocated to minimize downside deviation. If the score drops below 1.0, it signals that the portfolio is struggling to manage losses effectively.
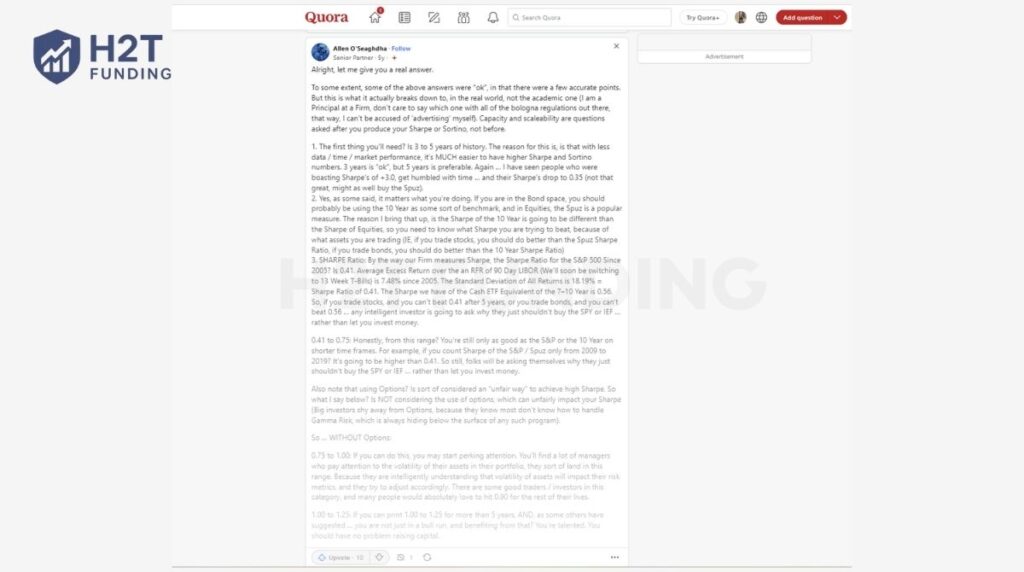
“If you trade stocks and can’t beat a 0.41 Sharpe (or equivalent Sortino) after 5 years, investors will ask why they shouldn’t just buy an index fund.” – Aaron Brown, MBA in Finance (Quora Quantitative Analysis)
Is a higher Sortino ratio better for funded traders? Generally, yes, as it demonstrates that your payouts are not just lucky wins but the result of a disciplined system. A higher ratio indicates that your strategy can survive market turbulence without wiping out your trading account balance.
3. Sortino ratio formula: How to calculate risk-adjusted performance
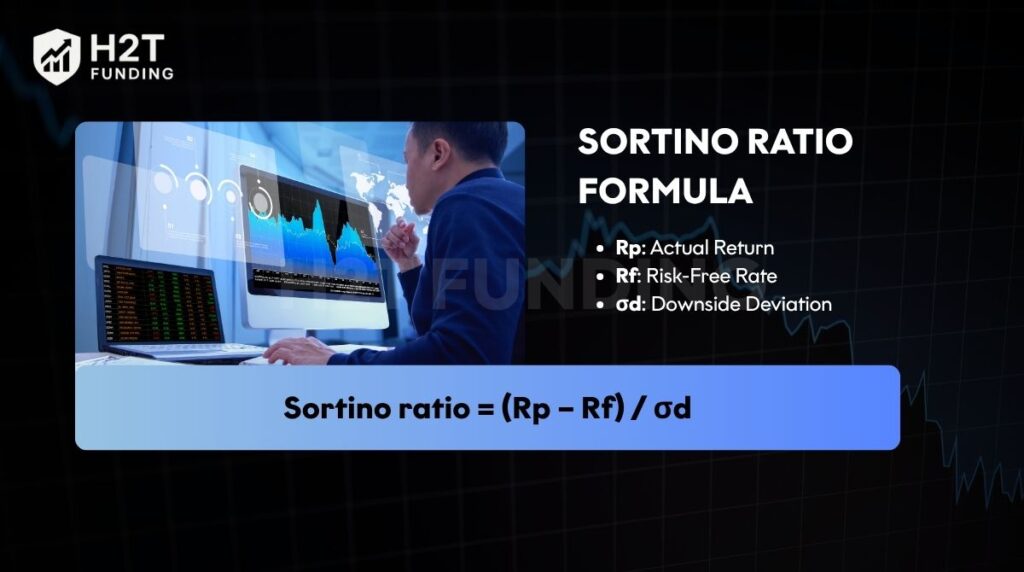
To understand what is Sortino ratio formula, you subtract the risk-free rate from your actual return, then divide it by the downside deviation. This mathematical calculation shows exactly how much excess return you generate for every unit of negative volatility.
Sortino ratio = (Rp – Rf) / σd
The calculation relies on three vital pieces of financial data to assess your performance:
- Actual Return (Rp): The total profit your investment or trading system generates over a specific time.
- Risk-Free Rate (Rf): The baseline profit you expect to beat without taking any risk. Investors often use a government Treasury bond yield as this safe baseline.
- Downside Deviation (σd): The specific measurement of your harmful risk.
To calculate this specific deviation, you only look at the losing periods in your data. You isolate the returns that fall below your target, square those negative numbers, average them, and find the square root. This process completely ignores any profitable periods, focusing strictly on the severity of your market losses.
To illustrate what is Sortino ratio with example, let’s compare two different investment funds. Assume a safe baseline rate of 3.75% for both.
- Fund A Calculation: (15% Return – 3.75% Risk-Free) / 18% Downside Deviation = 0.625
- Fund B Calculation: (14% Return – 3.75% Risk-Free) / 6% Downside Deviation = 1.71
Fund A has a higher total return but scores a poor 0.625. This indicates it takes on too much risk for its profit. Fund B scores a solid 1.71, proving it earns its returns much more efficiently despite a slightly lower overall profit.
Mastering this formula allows you to look past flashy profit numbers. By evaluating the exact cost of your losses, you can confidently choose strategies that protect your capital during turbulent market conditions.
4. Sortino ratio vs. Sharpe ratio: Key differences for traders
The primary difference between the Sortino ratio vs Sharpe ratio is the type of volatility each metric considers. While the Sharpe ratio measures total volatility including both gains and losses, the Sortino ratio focuses exclusively on harmful downside volatility.
| Feature | Sharpe Ratio | Sortino ratio |
|---|---|---|
| Formula | (Rp – Rf) / σp | (Rp – Rf) / σd |
| σp: Standard deviation of the portfolio’s excess return (volatility) | ||
| Risk Measure | Total Standard Deviation | Downside Deviation only |
| Sensitivity | Penalizes both upward spikes and crashes | Penalizes only negative price drops |
| Best Use Case | Low-volatility assets like bonds | High-volatility assets like stocks or Forex |
| Trader Perspective | Views all price movement as risk | Views positive swings as a benefit |
Why the Sortino ratio wins for prop traders?
This metric is often a higher-quality measure because it acknowledges that traders desire positive returns. Using the Sortino ratio vs Sharpe ratio formula reveals a similar structure, but replacing total risk with downside risk provides a more accurate performance audit. In high-leverage environments, you need a tool that proves you can handle drawdowns without being punished for catching massive trends.
Higher Sortino ratio means your strategy earns its profit much more efficiently by minimizing losing streaks. This data is vital for risk managers who want to ensure a strategy is sustainable rather than just lucky. It confirms that your trading edge provides a strong reward for every unit of “bad risk” you assume in the market.
Summary recommendation:
- Choose Sharpe Ratio if: You are evaluating a traditional portfolio of low-volatility assets like government bonds or broad indexed ETFs.
- Choose Sortino Ratio if: You are an active prop trader or investor in high-volatility markets like Forex, where protecting against downside drawdowns is your top priority.
While the Sharpe ratio offers a broad overview of general stability, the Sortino ratio provides the specific risk-management detail required for aggressive trading. It allows you to optimize your strategy for maximum growth while keeping a strict eye on capital preservation.
Read more:
5. Practical insight: Evaluating your portfolio with Sortino ratio Morningstar standards
Professional analysts use the Sortino ratio to evaluate the quality of a fund manager’s performance during market corrections. Using Sortino ratio Morningstar data allows investors to see which managers successfully protect capital while chasing high returns. This institutional standard ensures that a strategy’s success is based on skill rather than just luck in a bull market.
When determining what is a good Sortino ratio for a portfolio is, professionals look for more stability than in a single stock. A diversified portfolio should aim for a ratio above 1.5 to be considered elite by Morningstar standards. While a single trading strategy might be “good” at 1.0, a collection of assets should minimize losses more effectively to earn a higher score.
Professional standards provide the objective risk thresholds needed to manage large-scale capital successfully. Below are 3 reasons why these benchmarks matter for funded traders:
- Institutional Credibility: If your trading account matches Morningstar’s “Good” or “Excellent” benchmarks, you prove you are an investable professional.
- Risk Thresholds: Prop firms often use similar internal metrics to identify traders who can manage large-scale capital without high emotional volatility.
- Performance Stability: Aiming for these ratios helps you build a track record that attracts higher funding limits and better profit splits.
Aligning your performance with Morningstar benchmarks provides a clear, professional target. By aiming for institutional-grade ratios, you transform from a retail trader into a fund-ready professional capable of consistent success.
6. Advantages and limitations of using Sortino ratio
The primary advantage of this ratio is its strict focus on “harmful” volatility, giving investors a much clearer picture of actual risk. However, it also comes with limitations, as it heavily relies on long-term data to provide accurate results.
6.1. Key advantages of using Sortino ratio
The Sortino ratio’s primary benefit is focusing strictly on capital preservation by ignoring “good” volatility. Here are 3 key advantages of using the Sortino ratio for evaluating your trading edge:
- Accurate Risk Assessment: It only penalizes losses, meaning your strategy is not punished for having large, profitable winning trades.
- Goal Alignment: You can set a specific target return. The ratio then measures your success in exceeding that specific goal without suffering major drops.
- Better Comparison: It is the superior tool for comparing high-volatility strategies where catching big trends is the primary objective.
6.2. Key limitations of using the Sortino ratio
This metric is highly sensitive to the length of your track record and can be misleading over short periods. Below are 3 key limitations of using the Sortino ratio:
- Time Sensitivity: Analyzing less than three years of data can produce misleading results. A short-term winning streak easily hides the true downside deviation.
- Data Complexity: The calculation requires separating positive and negative returns. This is more time-consuming than calculating total volatility.
- Ignores Liquidity: A high score might mask the danger of holding illiquid assets that cannot be sold quickly during a market crash.
This calculation is an exceptional tool for measuring downside protection, but it should never be used alone. To properly assess your trading performance, combine it with a long track record to ensure your results are truly reliable.
7. FAQs
A bad score is anything below 1.0, and specifically any number below zero. When a score falls below zero, it means the investment is failing to beat a completely safe asset like a Treasury bill. A score between zero and 1.0 indicates that your profit is simply too small to justify the negative price swings you endure.
Historical data shows that the S&P 500 usually maintains a score around 0.94 over a 20-year period. The index provides consistent long-term growth, but it still experiences significant market crashes. This baseline score helps traders compare their personal strategies against the broader market’s average performance.
A strong combination usually involves a Sharpe score above 1.0 and a Sortino score above 1.5. When investors ask what is a good Sharpe and Sortino ratio is, they are looking for this ideal balance. This combination proves the strategy is highly efficient overall while maintaining excellent protection against severe market downturns.
While it sounds mathematically perfect, a score of 5 is highly unrealistic for traditional strategies and often points to flawed data. Is a Sortino ratio of 5 good? In reality, scores this massive are usually only found in high-frequency trading (HFT). For standard traders, a 5 often means the testing period was too short to capture real market drawdowns.
This calculation is superior for hedge funds because they frequently use asymmetric strategies like options trading. These funds actively pursue massive positive returns while strictly cutting losses. By only tracking negative variance, managers can accurately measure their capital protection skills without being penalized for huge winning streaks.
A negative result clearly tells you that the investment’s return is worse than the baseline risk-free rate. This means you took on market risk but earned less profit than if you had simply held cash in a government bond. This is a major warning sign that the current trading system is failing and requires immediate revision.
Yes, a higher calculation mathematically indicates better risk-adjusted performance, but it should not be trusted blindly. Is a higher Sortino ratio better in every single scenario? Not if the assets are highly illiquid or the track record is less than three years long. You must always verify the context of the data before making financial decisions.
8. Conclusion
Knowing exactly what is a good Sortino ratio allows you to shift your focus from chasing blind profits to protecting your capital. By aiming for a benchmark above 1.0 and striving for that excellent 2.0+ score, you prove that your trading system generates solid returns without suffering devastating drawdowns. This strict risk management is exactly what separates struggling beginners from highly successful professionals.
At H2T Funding, we know that disciplined risk control is the absolute key to securing and keeping your funded capital. If you want to learn more advanced methods for passing evaluations, explore our in-depth guides in the Trading Guides & Strategies to refine your edge and accelerate your trading career today.
Disclaimer: Prop firm rules and financial performance metrics can change based on market conditions. The benchmarks provided are for educational purposes and do not constitute professional financial advice. Always verify current terms and risk disclosures on official trading platforms before committing capital.