

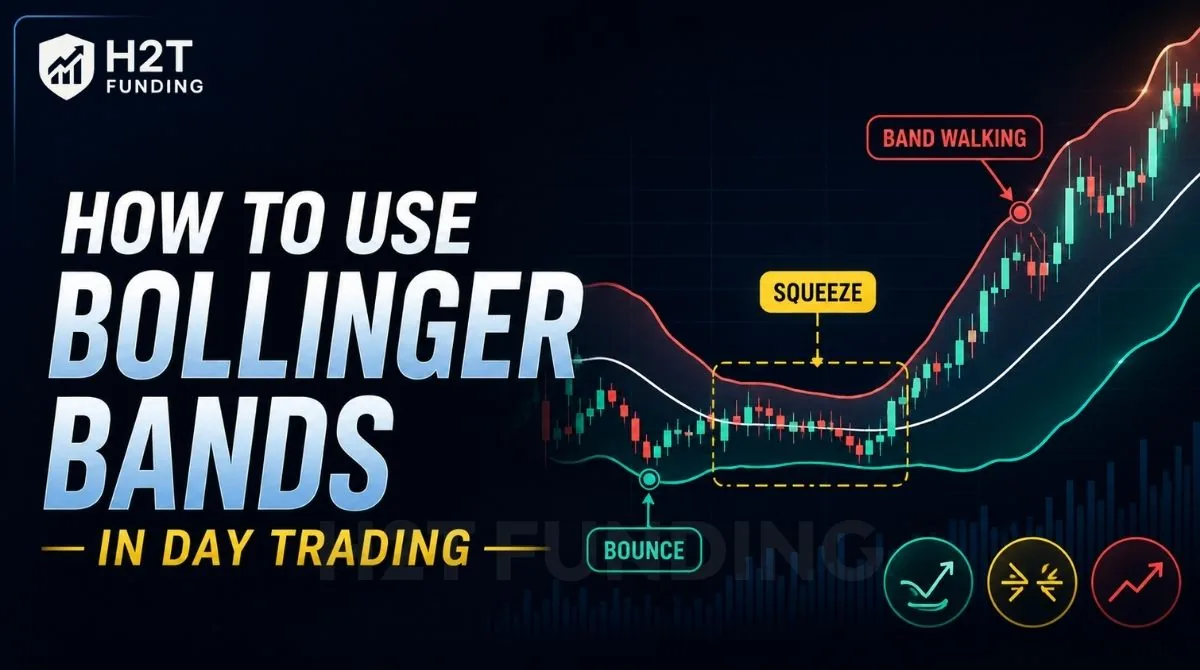
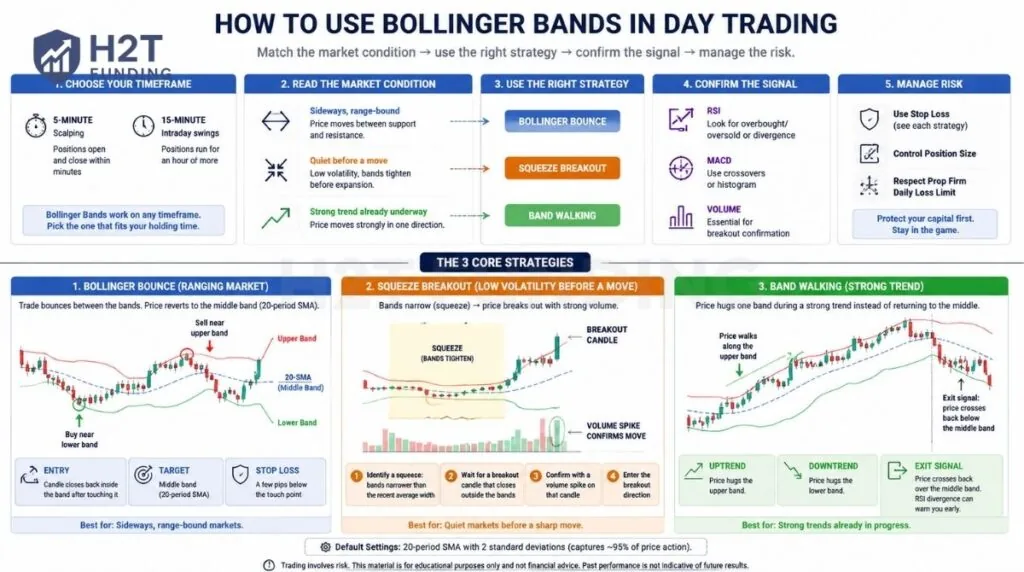
How to use Bollinger Bands in day trading? You watch how price moves relative to three lines built around a 20-period moving average, then trade one of three setups: a Bollinger Bounce when price snaps back to the middle band, a Squeeze breakout when the bands tighten before a move, or Band Walking when price rides one band through a strong trend.
This guide breaks down each setup, the timeframe that fits it best, how to pair Bollinger Bands with RSI or MACD, and how a breakout can affect a prop firm’s daily loss limit. Continue reading this H2T Funding article to find out more.
Key Takeaways:
- Bollinger Bands: a volatility indicator made up of three lines, a middle moving average with an upper and lower band plotted around it
- 3 core strategies: Bollinger Bounce (ranging markets), Squeeze breakout (low volatility before a move), and Band Walking (strong trends)
- 20-period, 2-standard-deviation: the default Bollinger Band setting most charting platforms load automatically
- 5-minute or 15-minute charts: timeframes many day traders commonly use for Bollinger Band setups, though the indicator applies to any chart interval
- RSI and MACD: the two indicators that confirm a Bollinger Band signal before you enter a trade
1. What are Bollinger Bands?
The Bollinger Bands indicator is a volatility tool made up of three lines: a middle simple moving average and an upper and lower band set two standard deviations away from it. John Bollinger built this tool in the 1980s to give traders a visual read on volatility, not just price direction.
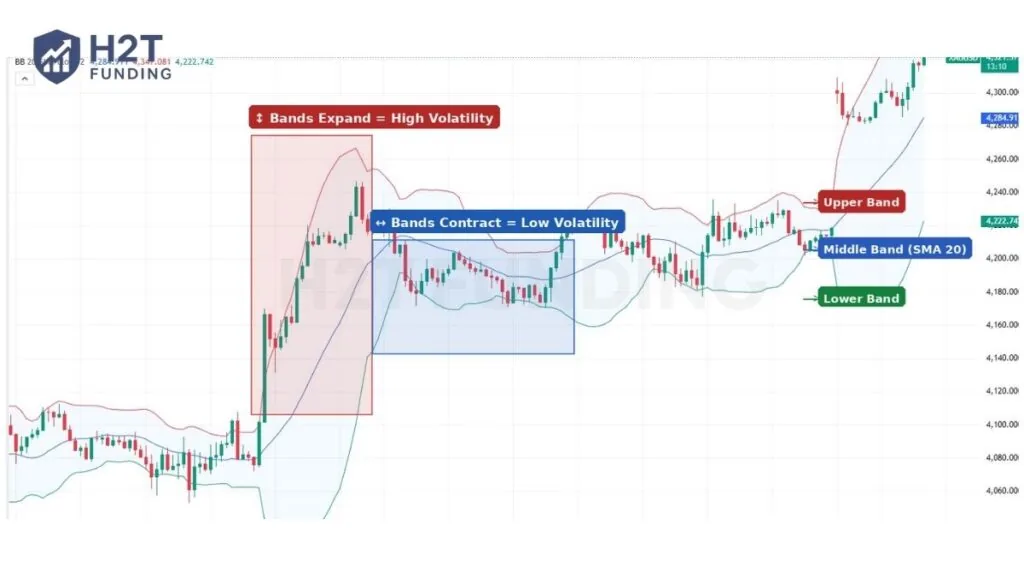
The middle band tracks the average price over a set period. The upper and lower bands expand when volatility rises and contract when it falls. That contraction and expansion is the signal most day traders watch.
| Band | Formula | What It Shows |
|---|---|---|
| Upper Band | 20-period SMA + (2 x standard deviation) | Price zone considered statistically high |
| Middle Band | 20-period SMA | Average price over the last 20 candles |
| Lower Band | 20-period SMA – (2 x standard deviation) | The price zone is considered statistically low |
The 20-period, 2-standard-deviation setting became the default because it captures about 95% of price action under normal conditions. Most charting platforms load these numbers automatically, so you don’t need to set them manually unless your strategy calls for a tighter or wider read.
2. How to use Bollinger Bands in day trading
In day trading, Bollinger Bands work best when you pair them with a specific timeframe and one of three core strategies: the Bollinger Bounce, the Squeeze Breakout, or Band Walking. Each one answers a different question about price behavior, and each fits a different market condition.
Many day traders commonly use a 5-minute chart for scalping, where positions open and close within minutes, or a 15-minute chart for intraday swings, where a position runs for an hour or more. Bollinger Bands apply to any timeframe, so pick the one that fits your holding time, then match it to the market condition you’re seeing.
| Market Condition | Recommended Strategy |
|---|---|
| Sideways, range-bound | Bollinger Bounce |
| Quiet before a move | Squeeze breakout |
| Strong trend already underway | Band Walking |
Start by checking whether the price is ranging or trending. A ranging market favors the Bounce. A market coiling tightly favors the Squeeze. A market already moving in one direction favors Band Walking. Each of these gets its own breakdown below.
2.1. Bollinger Bounce Strategy
The Bollinger Bounce strategy treats the bands as dynamic support and resistance in ranging markets, buying near the lower band and selling near the upper band. It relies on price reverting to the middle band after reaching an extreme.
As John Bollinger wrote in Bollinger on Bollinger Bands (McGraw-Hill, 2001, p. 112): “There is absolutely nothing about a tag of a band that in and of itself is a signal.” In a ranging market, a touch of the lower band may suggest oversold conditions. In a strong trend, that same touch can mean something different entirely.
Here’s a basic setup on a 15-minute chart in a ranging market. Price drops and touches the lower band. You wait for a candle to close back inside the bands, confirming the bounce rather than a breakout. Entry happens on that close, with the middle band as your first target and a stop placed just below the recent low.
- Entry: Candle closes back inside the lower band after touching it
- Target: Middle band (20-period SMA)
- Stop: A few pips below the touch point
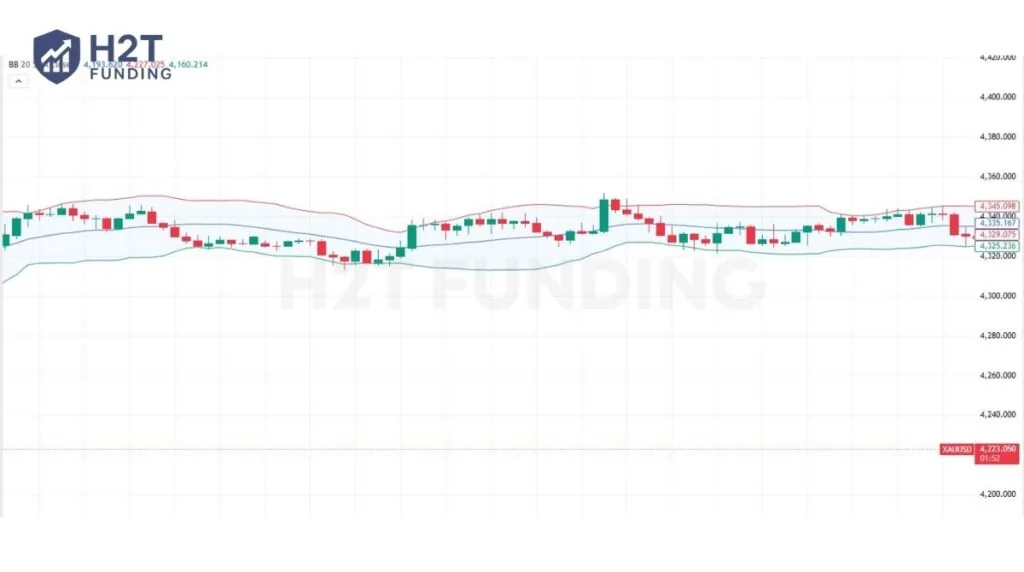
The chart above shows this playing out twice. Price dips to the lower band, closes back inside, and works its way to the middle band. Later, the same thing happens at the upper band, in the opposite direction. Neither move turns into a trend, which is what makes this a ranging market and a Bounce setup rather than Band Walking.
This strategy performs best in a sideways, ranging market. If the price is trending strongly, a touch of the lower band might not mean “oversold.” It might mean the trend is just getting started, which is where Band Walking takes over.
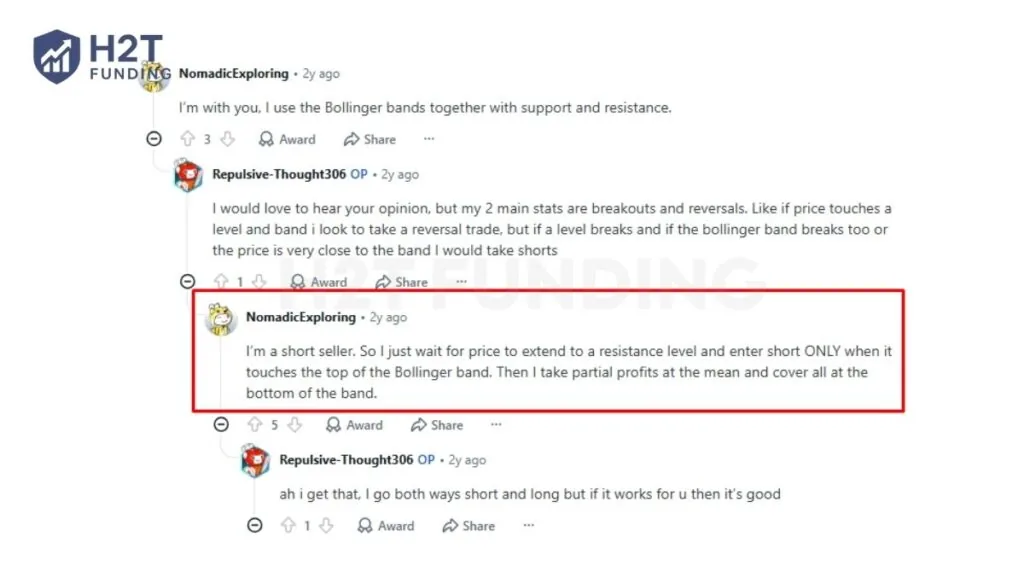
The same logic works in reverse for short setups. In a 2024 r/Daytrading discussion, one trader described their version: “I’m a short seller. So I just wait for the price to extend to a resistance level and enter short ONLY when it touches the top of the Bollinger band. Then I take partial profits at the mean and cover all at the bottom of the band.” – u/NomadicExploring, r/Daytrading, 2024. That sequencing mirrors the entry, target, and stop structure above, just mirrored for the upper band.
2.2. Bollinger Squeeze Breakout Strategy
A Bollinger Squeeze occurs when the bands narrow tightly, signaling low volatility before a sharp price move. You’ll see the upper and lower bands compress closer together than they have over the prior 10 to 20 candles.
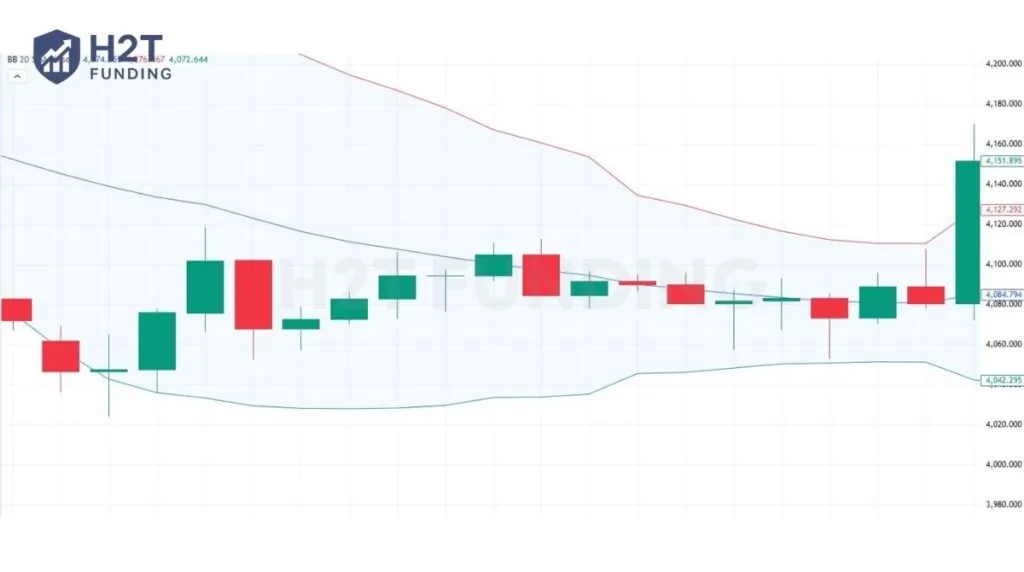
The chart above shows the setup forming step by step. Through the middle section, both bands tighten, and the candles trade in a narrow range. The final candle then closes above the upper band, the breakout signal that this strategy is built around.
To trade this setup, watch for the squeeze first. Then wait for the price to break through either band with a clear jump in volume. Enter in the direction of the breakout once that volume confirms the move.
- Identify a squeeze: bands narrower than the recent average width
- Wait for a breakout candle that closes outside the bands
- Confirm with a volume spike on that candle
- Enter the breakout direction
A breakout without rising volume often fails. Price pushes past the band, then snaps back inside within a few candles. That’s a false breakout, and it’s the most common reason this strategy loses money when traders skip the volume check.
2.3. Band Walking: Riding Strong Trends
Band walking happens when the price repeatedly touches or rides along the upper or lower band during a strong trend. Instead of bouncing back to the middle, the price stays glued to one band for several candles in a row.
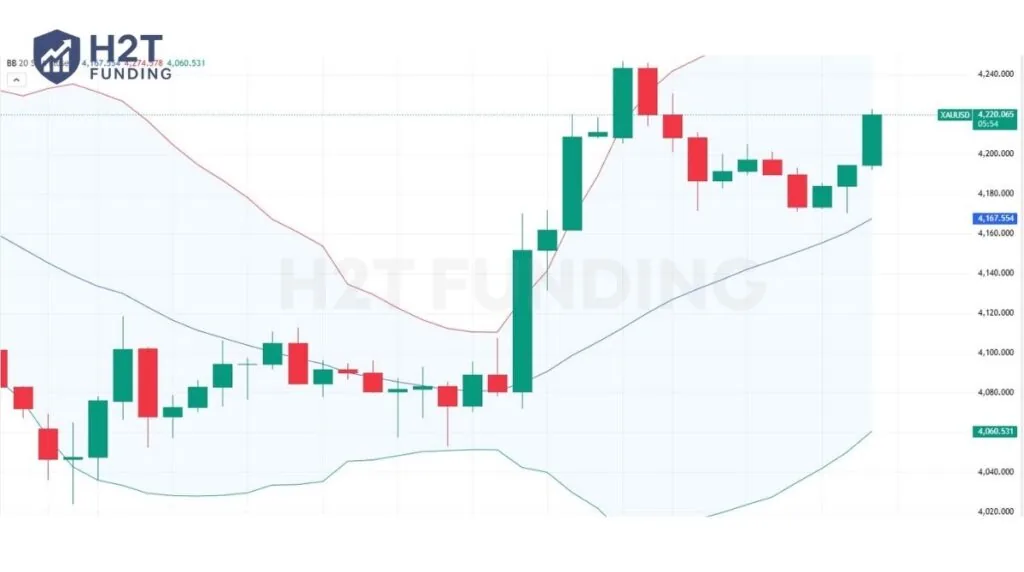
The chart above shows both setups back to back. The band narrows tightly in the middle of the chart, the Squeeze covered earlier, then the price breaks out and rides the upper band for several hours straight. That stretch is Band Walking: each candle closes near or above the upper band instead of pulling back to the middle.
During an uptrend, price hugging the upper band signals that buyers remain in control. The trend likely continues. The same pattern works in reverse during a downtrend: price hugs the lower band while sellers stay in control. In both cases, your main exit signal is price crossing back over the middle band, which often marks the point where momentum fades. RSI divergence, covered below, can give you an early warning before that crossover happens.
Reviewing XAUUSD on the 15-minute chart, we observed several sessions where price rode the upper band for 6 to 10 consecutive candles before crossing back over the middle band. Each of those crosses marked a clear momentum shift.
The annotated chart in the section above captures one such sequence, where the bands expanded sharply after a squeeze, and the price then tracked the upper band for multiple hours. Waiting for the middle band cross, rather than exiting at the first pullback candle, captured significantly more of the move.
Read more:
3. Combining Bollinger Bands with RSI or MACD
Bollinger Bands react to price after it moves, so pairing them with RSI or MACD helps confirm signals before entering a trade. On its own, a band touch tells you the price has reached an extreme. It doesn’t tell you whether that extreme will hold.
Some traders pair RSI with the Bollinger Bounce. When price touches the lower band and RSI falls below 30, both tools point to a similar oversold condition at the same time, which adds weight to a potential mean-reversion entry.
Many traders use MACD to confirm momentum during Bollinger Band breakouts. A MACD line crossing above its signal line as price breaks above the upper band gives an additional momentum signal in the same direction.
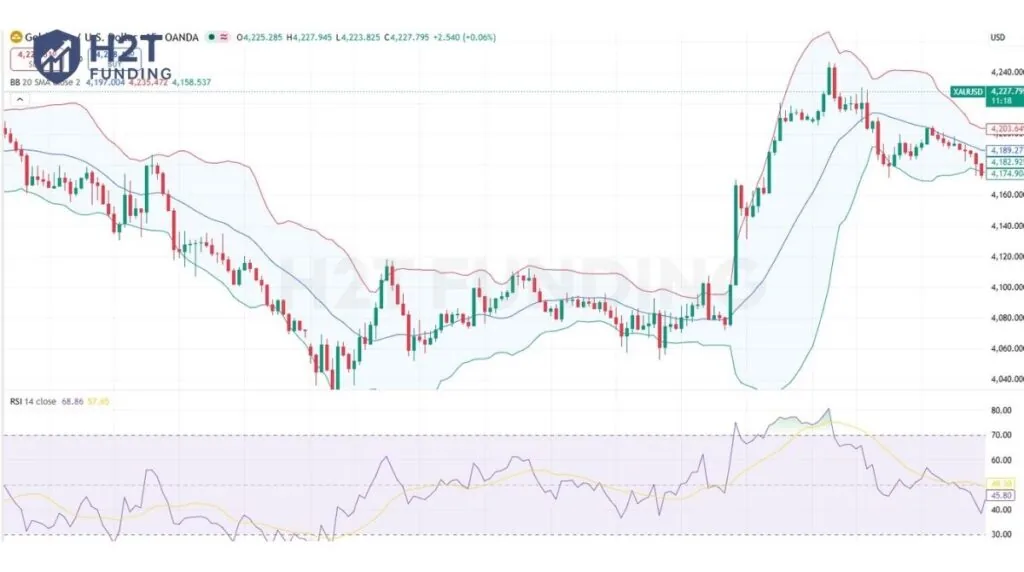
The chart above shows this confirmation in action. As the price drops and touches the lower band, RSI falls below 30 in the same window, both tools flagging oversold at the same time. Price then reverts toward the middle band, the same reversion that the Bollinger Bounce setup is built around.
| Bollinger Strategy | Confirming Indicator | Signal Example |
|---|---|---|
| Bollinger Bounce | RSI | Price touches the lower band, RSI below 30 |
| Squeeze Breakout | MACD | Breakout above the upper band, MACD crosses above the signal line |
| Band Walking | RSI (divergence) | Price keeps riding the upper band while RSI starts declining, an early warning before the middle band crossover |
Bollinger Bands forex traders most commonly apply this RSI and MACD combination to major pairs such as EURUSD or GBPUSD, though the same confirmation logic works across any liquid market, including XAUUSD and indices.
4. 4 Common mistakes when using Bollinger Bands in day trading
Most losses with Bollinger Bands in day trading come from four repeatable mistakes, and each one connects back to a strategy covered above.
- Trading the bands standalone. A band touch alone isn’t a signal. Pair it with RSI or MACD, as covered in the section above, before entering.
- Picking the wrong timeframe for your style. A 1-minute chart generates more noise than a 15-minute chart. Match your timeframe to whether you’re scalping or holding intraday swings.
- Confusing Band Walking with a Bounce setup. Shorting a touch of the upper band during a strong uptrend means trading against the trend, not with it.
- Entering a breakout without volume confirmation. A Squeeze breakout that lacks a volume spike often reverses within a few candles, turning a planned entry into a quick loss.
In practice, the first mistake causes the most damage over time. A single bad Bounce or Band Walking call costs one trade, but trading every band touch without confirmation racks up losses across dozens of setups in a single session. Reviewing your last 20 trades and checking how many entries had a second indicator lined up is a quick way to see if this mistake is eating into your results.
Most of these mistakes share one root cause: treating Bollinger Bands as a complete system instead of one piece of it. Traders who stick to a single timeframe, confirm every band signal with a second indicator, and match the strategy to the current market conditions tend to avoid all four.
5. Bollinger Bands Strategy and Prop Firm Risk Limits
A Bollinger Squeeze breakout can move price further and faster than a Bollinger Bounce, and that difference matters directly for traders managing a prop firm’s daily loss limit. A larger, faster move means a larger swing in your account balance within a single trade.
Example scenario: Say a funded account sits at $100,000 with a daily loss limit of 5%, or $5,000. A breakout trade risking 1% of the account ($1,000) that moves further than expected, say to 2%, before you can exit, now uses $2,000 of that $5,000 limit in one trade. That leaves $3,000 for the rest of the day.
The Bollinger Bounce and Band Walking tend to produce steadier, more predictable price swings than a Squeeze breakout. If your daily loss limit is tight, sizing down on breakout trades and keeping standard size on Bounce or Band Walking setups helps you stay inside that limit. Check your daily loss limit rules before sizing any breakout entry.
6. FAQs
-
Yes. Day traders use Bollinger Bands to measure volatility and spot price extremes within a single session. The bands help identify entry and exit points for the Bounce, Squeeze, and Band Walking strategies covered above.
-
The best way is to match the strategy to the market condition and confirm every signal with a second indicator. Use the Bounce in ranging markets, the Squeeze before breakouts, and Band Walking during strong trends, then confirm with RSI or MACD before entering.
-
Yes. Bollinger Bands are calculated off a simple moving average, which uses past price data. That makes the bands a lagging indicator, reacting to price moves rather than predicting them, which is why pairing them with a momentum indicator improves accuracy.
-
A 5-minute chart works best for scalping, while a 15-minute chart suits most intraday swing setups. Shorter timeframes generate more signals but also more noise, so match the chart to how long you typically hold a trade.
-
Bollinger Bands are often more effective when combined with other indicators. As Fidelity notes in its technical analysis guide: “The pair of bands is not intended to be used on its own. Use the pair to confirm signals given with other indicators.” On its own, a band touch shows where price sits relative to recent volatility. Pairing it with RSI or MACD adds momentum confirmation and reduces false entries.
-
The 20-period, 2-standard-deviation Bollinger Bands settings remain the standard starting point for day trading and work well on 15-minute charts. This default was established by John Bollinger himself and remains the most widely referenced configuration across charting platforms.
Some scalpers experiment with tighter settings such as a 10-period, 1.5-standard-deviation setup for faster signals on 1-minute or 5-minute charts, though this is a trader preference rather than an officially recommended configuration.
-
Bollinger Bands don’t have a fixed accuracy rate because they’re a lagging, reactive indicator rather than a predictive one. Their reliability improves when you confirm signals with RSI or MACD, as outlined in the combination section above.
-
Technically, yes, Bollinger Bands calculate the same way on any timeframe. For day trading, charts below 5 minutes tend to produce noisier, less reliable signals, so most day traders stick to 5-minute or 15-minute charts.
-
It depends on the market condition, and the distinction matters more than most traders expect. John Bollinger made clear in his book that a band touch alone carries no directional meaning; the same touch signals something different depending on what the market is doing.
In a ranging market, a touch of the upper band may suggest overbought conditions and a potential Bounce back to the middle. In a strong uptrend, that same touch often means the trend is continuing, which is Band Walking, not a reversal signal.
-
Yes, when used correctly. Bollinger Bands work well in day trading as a volatility and price-extreme identifier, particularly when combined with RSI or MACD to confirm entries. They are less effective as a standalone tool in fast-moving or low-liquidity markets.
7. Conclusion
Knowing how to use Bollinger Bands in day trading comes down to matching the right strategy, Bounce, Squeeze, or Band Walking, to the market condition in front of you, then confirming every signal with RSI or MACD before you click buy or sell. Start with one strategy, test it on a single timeframe, and build from there.
For more setups like this, read the articles in the Trading Guides & Strategies category on H2T Funding.
Disclaimer: Bollinger Bands and the strategies above are technical analysis tools, not guarantees of profit. Past price behavior doesn’t guarantee future results. Always test any strategy on a demo account before applying it to a live or funded account, and review your prop firm’s specific risk rules before sizing trades.