Learning how to read candlestick chart for day trading means analyzing the open, high, low, and close prices over short timeframes. This essential skill helps traders spot rapid momentum shifts and understand market sentiment instantly.
Whether you are a beginner or aiming to pass an evaluation at a prop firm, mastering these visual cues is your first step to trading success. Read now with H2T Funding!
Key takeaways
- Every candle displays the open price, high price, low price, and close price for a specific period.
- The thick body shows the actual price movement between open and close. Thin lines, called shadows or wicks, indicate price extremes.
- A green or white body signals bullish momentum. A red or black body indicates a bearish trend.
- Always combine these chart patterns with volume and support levels to confirm trading signals effectively.
1. How to read candlestick chart for day trading?
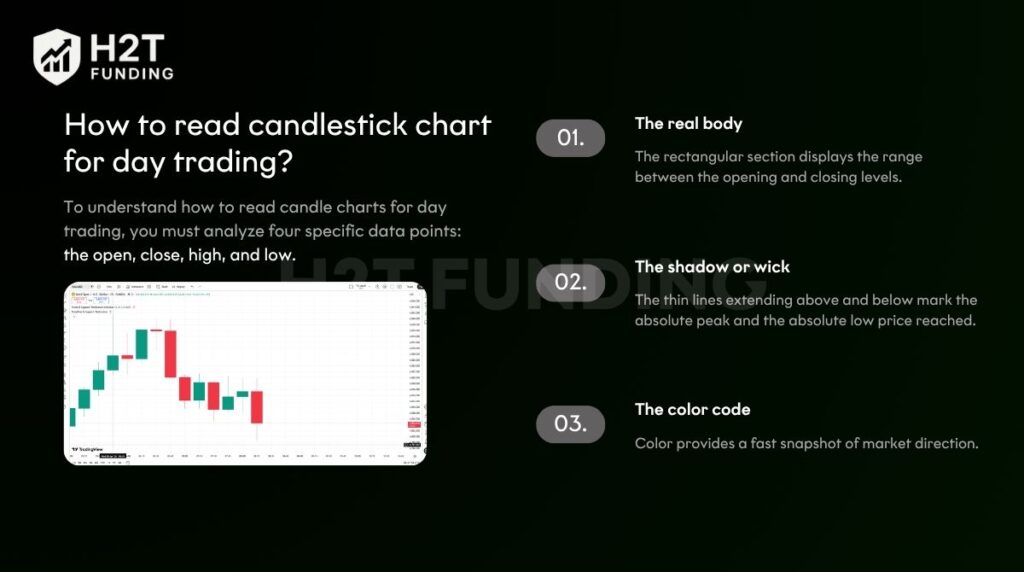
To understand how to read candle charts for day trading, you must analyze four specific data points: the open, close, high, and low. These elements create a visual summary of the market’s activity over a specific timeframe. It shows the ongoing battle between buyers and sellers. This forms the foundation of technical analysis.
- The real body: The rectangular section displays the range between the opening and closing levels. A long body often indicates strong momentum and intense buying or selling pressure, but it should be confirmed with volume and market context to avoid fake moves caused by news spikes.
- The shadow or wick: The thin lines extending above and below mark the absolute peak and the absolute low price reached. These wicks show us price rejection and market volatility. For example, a long upper wick means buyers tried to push the asset up but failed.
- The color code: Color provides a fast snapshot of market direction. A green or white appearance means the session was bullish. A red or black appearance indicates a bearish period, meaning sellers pushed the final value down.
Learning how to read stock candlestick for beginners properly gives you a distinct advantage and helps you master the financial terms every beginner should know before entering live markets. It translates raw numbers into a clear visual story. Once you master these core basics, analyzing price action becomes much easier.
2. Best timeframes for intraday price action
Common timeframes for intraday price action include short intervals like the 1-minute, 5-minute, or 15-minute charts, depending on your strategy. While lower timeframes are used for precise entries, professional traders still utilize daily charts to identify the broader bias and key price levels. Focusing only on these low timeframes can cause you to miss this larger context.
Learning how to read candles for day trading effectively means zooming in. This helps you catch immediate opportunities before the trend changes.
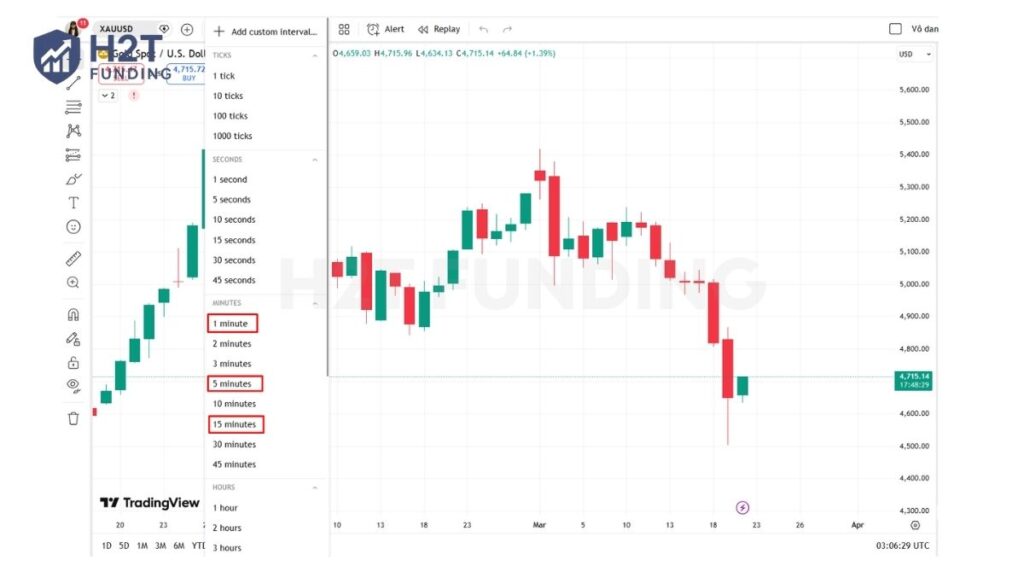
A proven strategy is combining multiple timeframes to get a clearer picture. For instance, you can use a 15-minute timeframe to identify the broader trend. Here, you can easily spot key resistance levels and major support zones. Then, switch to a smaller 5-minute window to pinpoint precise entry points.
Understanding how to read charts for day trading involves syncing these different views. By mastering multi-timeframe analysis, you filter out confusing market noise. This ensures you wait for proper confirmation before placing any trades, making your strategy much safer and more reliable.
3. Essential candlestick patterns every day trader must know
You don’t need to memorize dozens of formations. Instead, focus on a few high-probability chart patterns that signal clear shifts in market psychology.
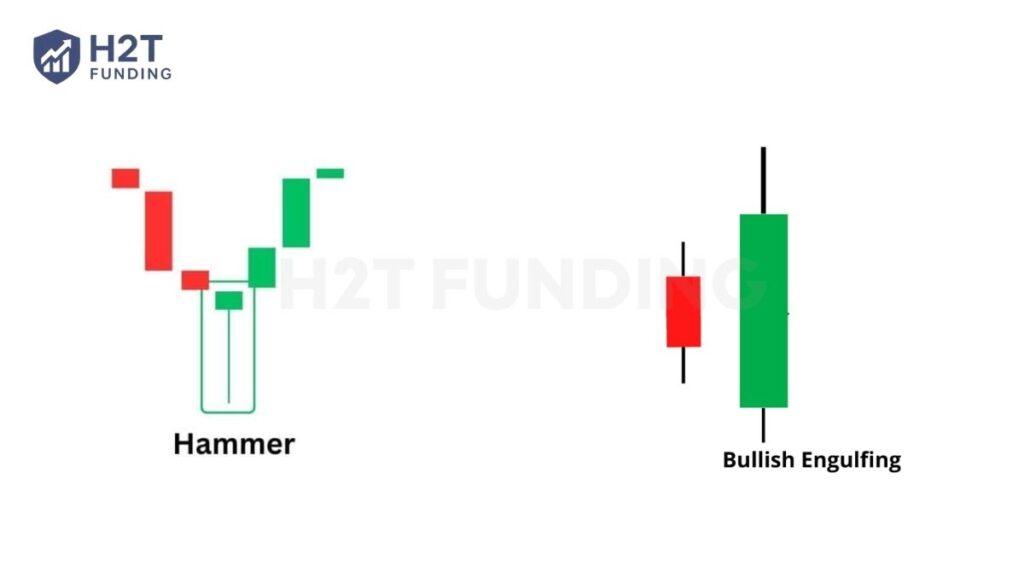
3.1. Bullish reversal patterns
These patterns appear after a downtrend and suggest buyers are gaining control. They signal a potential trend reversal to the upside.
- Hammer: This pattern has a short body with a long lower shadow. It shows that sellers tried to push the price down, but strong buying pressure drove the close back near the open. A hammer can signal a potential reversal, especially when it appears at a support level or is confirmed by a spike in volume.
- Bullish Engulfing: This two-candle pattern occurs when a large green candle completely engulfs the body of the previous red candle. It demonstrates a decisive shift in momentum, indicating that buyers have overwhelmed sellers.
In short, when you spot these patterns at the end of a downtrend, it’s a strong hint that the selling may be over.
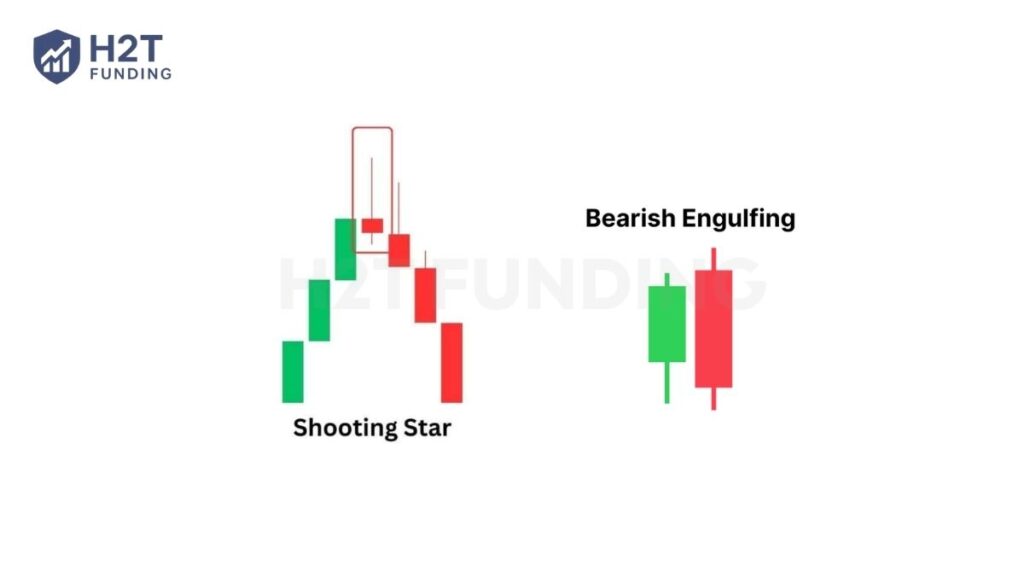
3.2. Bearish reversal patterns
These formations show up after an uptrend and indicate sellers are starting to dominate. They serve as a warning that the price movement might soon reverse downwards.
- Shooting Star: The opposite of a hammer, this candle has a small body at the bottom with a long upper shadow. Buyers attempted to push the price higher but were rejected. This shows weakening upward momentum.
- Bearish Engulfing: This pattern forms when a large red candle completely covers the body of the preceding green candle. It’s a strong signal that selling pressure has taken over, often marking a market top.
Essentially, these patterns warn you that the upward trend could be losing steam and a decline may be imminent.
3.3. Market indecision signals
When neither buyers nor sellers are in control, these patterns emerge. They signal a pause in the current trend and a potential change in direction.
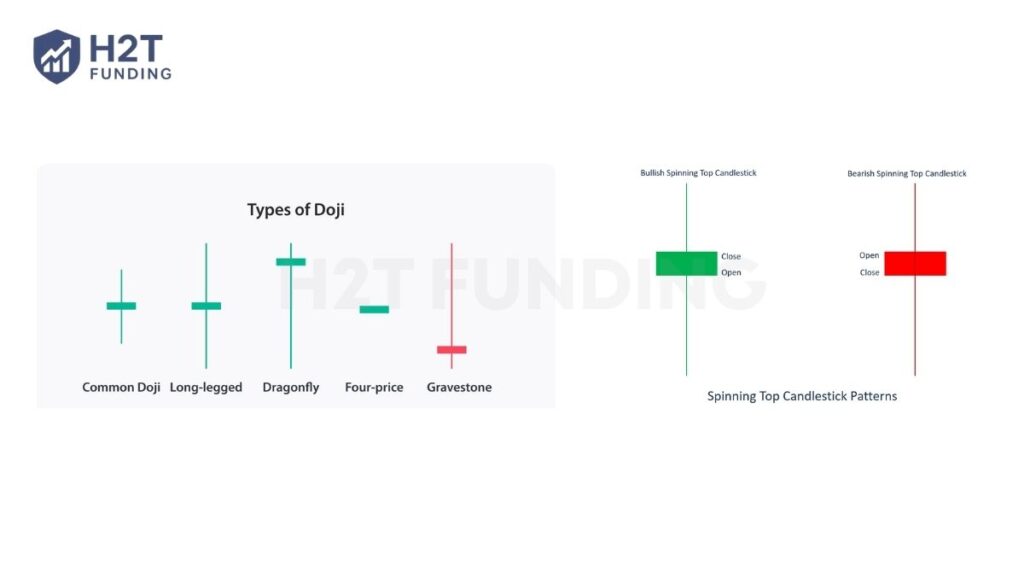
- Doji: This candlestick looks like a cross because its opening and closing prices are nearly identical. The doji represents a perfect stalemate between bulls and bears.
- Spinning Top: A spinning top has a short body centered between wicks of similar length. It shows that both sides were active, but neither could gain the upper hand, indicating market indecision.
Ultimately, these signals tell you to be cautious, as the market is pausing to decide on its next major move.
3.4. Real-chart analysis: Putting theory into practice.
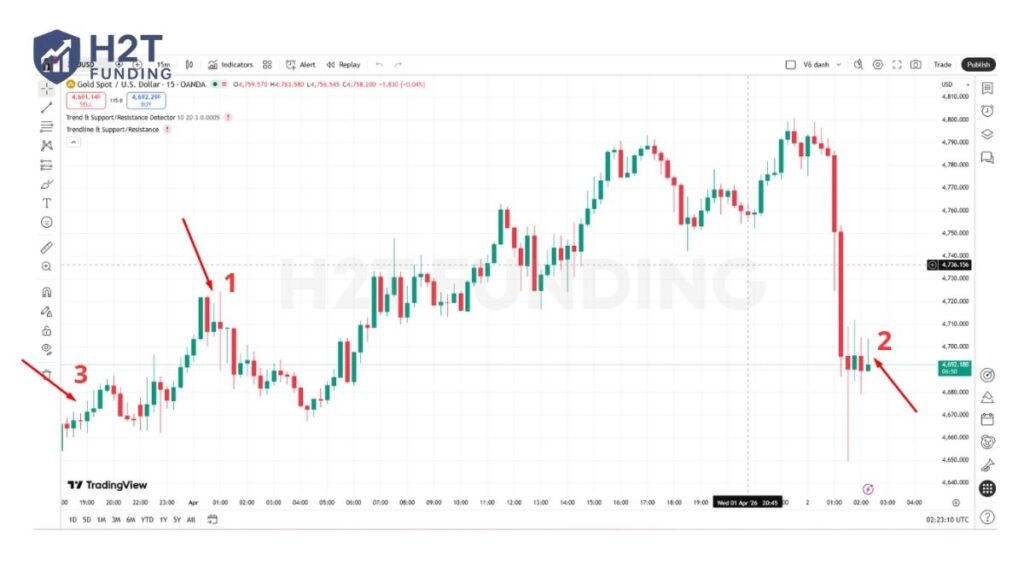
To truly understand how to read candlestick charts for day trading, you must look at them in context. Let’s break down the real market scenario below:
- Point 3 (Bullish Reversal): At the bottom left, after a minor dip, strong buying pressure steps in. A large green candle forms, overpowering the previous red ones, signaling the start of a new uptrend.
- Point 1 (Bearish Reversal): After a solid run-up, the market prints bearish candles and upper wicks (price rejection) at a local high. This is a clear warning that bullish momentum is exhausted, leading to a quick pullback.
- Point 2 (Market Indecision): Following a massive, aggressive drop, the market suddenly prints tiny Doji and Spinning Top candles. This indicates that the intense selling pressure has temporarily stopped, and the market is in a state of indecision before its next move.
Mastering these core patterns is essential. They provide powerful trading signals about where the market might head next. Instead of just reacting to price changes, you can start to anticipate them.
4. Common mistakes beginners make when reading candlestick charts
Recognizing patterns is only half the battle; avoiding common traps is equally important. Many traders fail not because their analysis is wrong, but because they fall into predictable psychological traps. Understanding these errors is a key step in learning how to read candlestick charts for beginners.
Here are three critical mistakes to avoid:
- Trading Before the Candle Closes: A pattern is not valid until the trading period ends. For example, a candle might look like a strong bullish hammer mid-session, prompting you to buy early. However, a sudden wave of selling pressure can push the price down before the close, leaving you with a losing trade and a candle with a long upper shadow. Patience is crucial; always wait for the candle to close for confirmation.
- Ignoring the Market Context: A single candlestick pattern in isolation means very little. A powerful bearish engulfing pattern appearing at a major resistance level is a much stronger signal than one appearing in the middle of a random range. You must combine candlestick analysis with other tools. Always check for support levels and analyze volume to validate the signal.
- Trading the Opening 15 Minutes: The first 15 minutes of market open are highly volatile. While some experienced traders utilize opening range breakout strategies, beginners often avoid this period to let the market settle and establish a clearer direction.
By consciously avoiding these mistakes, you improve your odds of success dramatically. Successful trading is about discipline and making informed decisions, not just spotting patterns. This patient and contextual approach is fundamental to sound technical analysis.
Read more:
5. Pro tips: Using candlesticks to pass challenges
Passing a funded challenge requires more than just pattern recognition; it demands a professional mindset. Here is how to elevate your candlestick trading strategy:
- Always Wait for Confirmation: Think of a candlestick pattern as a signal, not a command. A single candle can be misleading. For example, after spotting a bullish hammer, a professional trader waits for the next candle. If the following candle is also strongly bullish and closes higher, that is your confirmation. Acting without it is simply gambling.
- Practice Strict Risk Management: This is non-negotiable. Even the most reliable patterns can fail. Your job is not to be right 100% of the time, but to protect your capital when you are wrong. When you enter a trade based on a pattern, immediately define your risk. A logical stop-loss could be placed just below the low of a hammer’s shadow or above the high of a shooting star.
- Master, Don’t Memorize: Instead of trying to learn 20 different patterns, focus on mastering just two: one bullish and one bearish. For example, become an expert on the bullish engulfing pattern at support levels and the bearish engulfing pattern at resistance. Understand their nuances and how they behave in different market conditions by recording every trade in a trading journal to track your progress and identify your ideal trade setups. Depth of knowledge beats breadth every time.
- Understand Market Structure: Don’t just look at individual candles; always pay attention to market structure, such as higher highs or lower lows, to identify the true trend direction. Candlestick signals are only as strong as the trend they are part of.
By integrating these habits, patience for confirmation, disciplined risk management, and focused mastery, you shift from being a pattern spotter to a true strategist. This is the level of advanced technical analysis required to consistently profit and pass trading evaluations.
6. FAQs
Reading candlesticks for day trading involves analyzing four key data points for short timeframes: the open, high, low, and close (OHLC). The body represents the price range between the open and close, while the wicks (or shadows) show the price extremes. Color indicates direction: green for bullish moves and red for bearish moves, helping you spot momentum shifts quickly.
Candlestick charts are widely considered the best for day trading. While line charts only show the closing price and bar charts are less intuitive, candlestick charts provide a rich visual story of market sentiment. Their color-coded bodies and wicks make it easier to instantly recognize buying or selling pressure.
No single pattern is “most profitable” because context is everything. However, many traders find the Engulfing patterns (both Bullish and Bearish) to be highly effective. This is because they signal a very strong and decisive momentum shift where one side has completely overwhelmed the other. The Hammer is also highly regarded for signaling bottoms.
For beginners, the best patterns are those that are simple and easy to identify. A great starting point is the Bullish and Bearish Engulfing pattern. Its visual is clear: a large candle overpowering a smaller one. This makes the story of the market struggle easy to understand without complex interpretation.
These are not universal rules but rather common trading strategies: 2-Candle Rule: Often refers to patterns like the Engulfing, where a two-candle sequence signals a potential reversal. 3-Candle Rule: Typically used for confirmation patterns like the Morning Star or Evening Star, which require three candles to complete the signal. 5-Candle Rule: Some traders use five consecutive candles of the same color as a signal to confirm a strong trend, but this is a personal heuristic rather than a universal market rule.
This is a risk management strategy, not a pattern rule. It advises traders to avoid placing trades during the first 15 minutes after a major market opens. This period often has extreme volatility and generates unreliable patterns, so waiting allows the market to establish a clearer direction.
Volume acts as a confirmation tool. A candlestick pattern that forms with high or increasing volume is considered much more significant. For example, a Bullish Hammer appearing on a huge spike in volume strongly suggests that the reversal has significant buying power behind it.
Absolutely. Candlestick analysis is a universal tool because it reflects human psychology, fear, and greed. These emotions drive price action in all financial markets, whether you are trading stocks, Forex, commodities, or cryptocurrencies.
The biggest danger is trading patterns in isolation. A perfect-looking candle pattern means very little if it isn’t happening at a significant market level (like support or resistance). Beginners often make the mistake of seeing a Hammer and immediately buying, without checking if the broader trend supports their decision.
They are reliable as indicators of probability, not certainty. No pattern works 100% of the time. Their effectiveness increases dramatically when you combine them with other forms of technical analysis, wait for confirmation, and apply strict risk management on every single trade.
7. Conclusion
Mastering how to read candlestick chart for day trading is a foundational skill for any serious trader. It transforms complex price data into a clear visual map of market sentiment. By combining these patterns with strict risk management and confirmation, you can build a consistent edge in the markets.
This journey is just the start of your path to professional trading. To further sharpen your skills and prepare for a funded account, explore our expert resources. Check out our Trading Strategies category at H2T Funding today. We provide the insights and tools you need to succeed in the competitive world of prop trading.