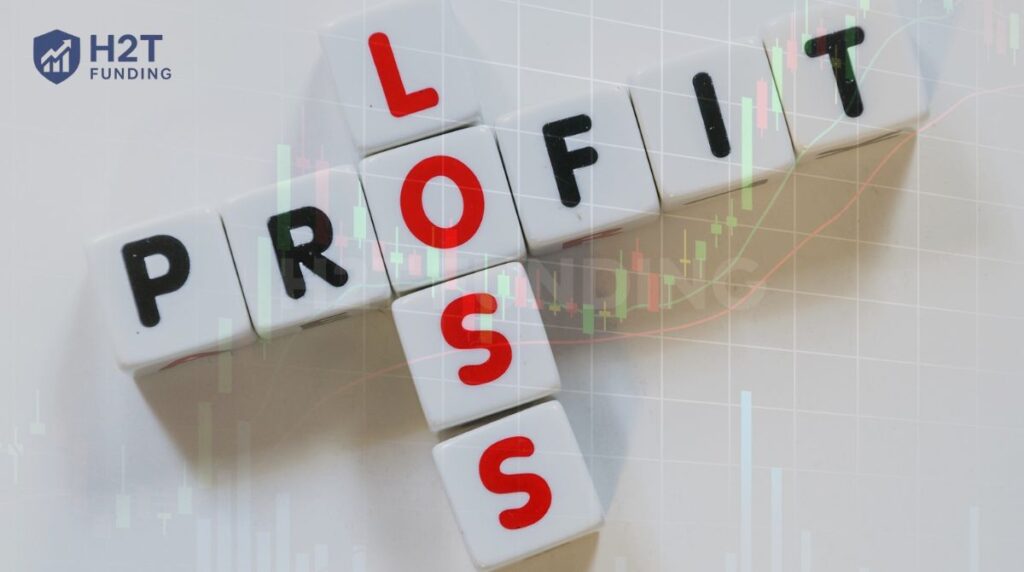
If you’ve ever asked yourself what is PnL in trading, you’re not alone. I remember the first time I saw that number moving beside my trades and wondered if it meant I was winning or losing. P&L (Profit and Loss) simply shows how much you’ve earned or lost on a trade, but it also reflects your discipline and risk control as a trader.
At H2T Funding, we believe that understanding your PNL is the first step to trading smarter, not harder. Once you know how to read and calculate it, you’ll see your performance more clearly and make better trading decisions. Ready to master it? Let’s dive in.
Key takeaways:
- PnL (Profit and Loss) shows the real result of your trades, telling you if you made or lost money.
- It has two forms: Realised PnL (for closed trades) and Unrealised PnL (for open positions still moving).
- The basic PnL formula is simple: (Exit Price – Entry Price) × Position Size.
- Factors like fees, leverage, and position size can change your final results.
- Tracking PnL helps improve your risk management and shape a stronger trading strategy.
1. What is PnL in trading forex?
Let’s be honest, when you first look up what’s PnL in trading, the concept sounds more complicated than it really is. PnL simply stands for profit and loss. It shows the difference between how much money you made and how much you lost from your trades.
In other words, PnL tells the story of your trading results. When a trade closes in profit, PnL is positive. When it ends in a loss, it’s negative. Simple, right? Still, that tiny number on the screen carries a lot of meaning. It’s not just a measure of money; it’s a reflection of decision-making, patience, and even emotions when things get tough.
I think every trader has a love-hate relationship with PnL. Some days you feel proud; other days you question everything. And that’s okay. The key is to understand what it’s really telling you. Because once you do, your PnL becomes more than just a result. It becomes feedback, the kind that helps you grow as a trader.
2. How P&L works in trading
Understanding how PnL works in trading is like watching a heartbeat monitor for your account. Every price move, every fluctuation in the market, makes your profit and loss rise or fall.
I still remember one of my first forex trades. I jumped in too early, thinking the chart would reverse in my favour. It didn’t. My PnL went deep into the red, and that sting taught me more about risk management than any YouTube tutorial ever could.
Let’s break it down simply:
- Your opening and closing levels decide your outcome. If you buy low and sell high, you make money. The opposite means a loss.
- Position size magnifies everything. A bigger trade means bigger profits or bigger pain.
- Transaction costs matter. If you ignore them, your numbers won’t be accurate.
- Leverage can boost returns, but it’s a double-edged sword. The same power that grows your profits can also erase your account if you’re not careful.

In short, your PnL changes with every market tick. When it’s green, don’t get overconfident. When it’s red, don’t panic. Instead, ask why it moved. Was it timing, position size, or pure market volatility? Once you learn to read those signals, your PnL becomes more than a number; it becomes feedback that helps you trade smarter.
3. Types of PnL in trading: Realised vs. Unrealised
When you trade, your PnL can fall into two categories: realised and unrealised. Knowing the difference matters more than most beginners think.
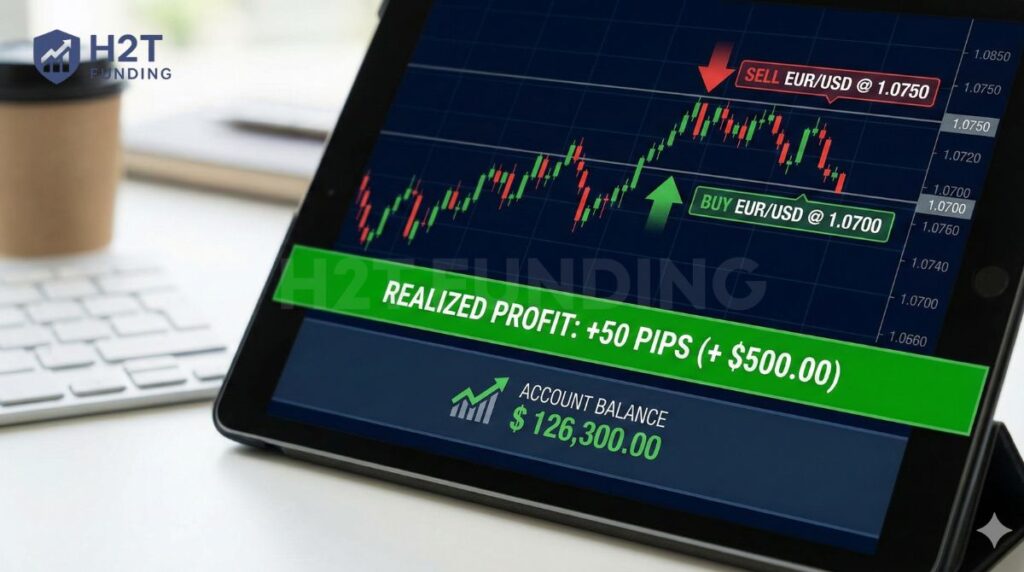
Realised PnL is the profit or loss you’ve actually locked in after closing a trade. Once you click that close button, your gain or loss becomes real. For example, if you bought EUR/USD at 1.0700 and sold at 1.0750, you made a 50-pip profit. That’s realised. It’s already part of your account balance.
Unrealised PnL, on the other hand, helps answer the question: what is floating PnL in trading? It refers to the profit or loss on open positions that are still moving and changes with every market tick.
If your trade is still running, your PnL can swing from green to red in seconds. That’s why traders sometimes say, “It’s not profit until you close the trade.”
I think every trader experiences that emotional rollercoaster. You see a big unrealised profit, hesitate to close, then watch it vanish when the market reverses. It hurts, but it’s a valuable lesson. Unrealised PnL teaches patience and timing. Realised PnL teaches discipline.
In short, realised PnL shows what you’ve earned. Unrealised PnL shows what could still change. Both are important, but only one truly reflects your performance at the end of the day.
4. How to calculate PnL (formula and examples)
If you’ve ever searched for “what is PnL in trading example” or “how is PnL calculated,” this part will make it clear. Honestly, many traders overthink it. The truth is, the math behind PnL (profit and loss) is simple once you understand the basics.
So, what is a PnL in trading? It depends on the direction of your trade. Here are the formulas for both scenarios:
- Long (Buy): PnL = (Exit Price – Entry Price) × Position Size
- Short (Sell): PnL = (Entry Price – Exit Price) × Position Size
Let’s look at a quick example. Suppose you buy EUR/USD at 1.0700 and sell at 1.0750. If your position size is one standard lot (100,000 units), your calculation is (1.0750 – 1.0700) × 100,000. The result is $500.
However, this is just your Gross PnL. To find the real number, you must subtract fees and commissions.
Net PnL = Gross PnL – (Commissions + Swaps)
If your broker charges $7 in commission and $3 in swap, your Net PnL is $490 ($500 – $10). Ignoring these costs is a common mistake; across dozens of trades, these small fees can materially affect your total PnL. Also, be aware of leverage. It can amplify your profits or your losses, especially in forex trading.
If you want to compare performance accurately, especially when using leverage, use the growth formula favoured by professional funds:
PnL % = ((Final Account Value / Starting Account Value) – 1) × 100
For example, if you start with $10,000 and your equity grows to $10,400, the calculation is (($10,400 / $10,000) – 1) × 100, which equals 4%. This method gives a clearer picture of your strategy’s efficiency over time compared to just summing up individual pips.
In short, calculating PnL helps you understand your trades, refine your approach, and keep emotions in check. And that’s something every successful trader learns sooner or later.
5. How PnL is used in a trading strategy
When people ask what is PnL in a trading strategy, they usually want to know how it fits into decision-making, not just how to calculate it. In reality, Profit and Loss (PnL) is one of the most important feedback tools any trader has. It tells you, in plain numbers, if your trading plan is working or not and if it justifies how much a funded account costs.
I think of PnL like a performance review. Each trade, whether it’s a win or a loss, gives you data. You can analyse that data to refine your trading strategy, improve risk management, and even understand your behaviour under pressure.
Here is how professional traders use PnL data to optimise performance:
- Strategy evaluation: PnL tells you if your trading strategy is profitable based on what is PnL trading is. By tracking which setups generate positive PnL, you can focus on what works best.
- Risk management: Your PnL history reveals the actual risk per trade. If losses are too large relative to your balance, you must adjust your position size, especially if you are managing the smallest account size to trade futures.
- Performance tracking: Instead of focusing on daily outcomes, analyse weekly or monthly PnL trends. This helps you identify consistency, which is the core factor in knowing how to pass a prop firm challenge.
- Optimise strategy: By comparing your realised PnL and unrealised PnL, you can find whether you’re exiting trades too early or holding too long.
Let’s say you have a forex trading strategy that performs well in trending markets but fails during sideways conditions. Reviewing your PnL report helps you confirm that observation. You might then tweak your rules or switch instruments.
PnL isn’t just about profit. It’s a clear measure of what’s working and what’s not. Once you learn to read it properly, your PnL becomes a map showing where to steer your trading journey next.
6. Common mistakes when interpreting PnL
Even experienced traders sometimes misunderstand their profit and loss (PnL), especially when emotions take over. When people ask what PnL is in trading, or pnl what P&L is, they often focus only on the final number. But PnL is more than that. It’s a combination of math, discipline, and psychology.
Here are some common mistakes that can distort how traders read their PnL:
- Ignoring trading costs: Many traders forget about spreads and swap charges when reviewing their performance. These small costs can slowly eat into your realised PnL. If you make dozens of trades each week, the total cost might surprise you.
- Mixing realised and unrealised PnL: It’s easy to confuse what’s already earned with what’s still floating. Unrealised PnL changes constantly as market prices move, while realised PnL only updates when you close a trade. Mixing them can give you a false sense of profit.
- Misunderstanding leverage: Leverage multiplies your trading positions, which sounds exciting until it works against you. A 1% move in price can double your profit or your loss. Always calculate PnL with leverage in mind so you understand your real risk exposure.
- Overlooking position size: Your position size should match your risk management rules. Taking oversized trades can lead to big PnL swings and unnecessary stress. It’s better to stay consistent than to gamble for quick wins.
- Not analysing PnL data properly: PnL isn’t just a record of profits and losses. It’s a tool for review and evaluation. By studying your trading strategy and looking for recurring patterns, you can improve your decision-making and reduce mistakes in future trades.
In short, your PnL is one of the most honest indicators of your trading habits. If you treat it carefully and learn from it, it becomes more than a number; it becomes a mirror reflecting your growth as a trader.
7. Why understanding PnL matters for long-term success
If you’ve ever wondered what P&L is PnL explain or why traders talk about profit and loss so often, the answer is simple. Your PnL is the truth behind your trading performance. It tells you what’s really happening with your money, not what you hope is happening. That’s why understanding it deeply is essential for long-term success.
In trading, everything comes down to consistency. Knowing your PnL helps you see whether your trading strategy is working, which is crucial before asking can you trade options on a funded account and if your risk management plan is holding up.
For instance, if your realised PnL shows steady gains but your unrealised PnL keeps jumping, it could mean your position size is too big, a common issue in CFD trades with a less than USD 25k account.
I think of PnL as more than just a number. It’s a performance indicator that reflects both skill and discipline. It shows whether you’re following your plan or letting emotions take control. And the more you track it, the better you’ll understand your strengths and weaknesses.
Here’s how focusing on PnL helps you grow:
- Emotional control: Watching your PnL daily teaches patience and helps reduce impulsive trades.
- Better decision-making: Reviewing PnL data keeps your strategy grounded in facts, not feelings.
- Continuous improvement: You can refine entries and exits and adjust your strategy based on PnL trends.
I’ve met traders who ignored their PnL because they thought it was just accounting. Most of them didn’t last. Successful traders, on the other hand, treat their profit and loss as a roadmap, which is the first step in understanding how to get into prop trading. It shows where they’ve been, where they went wrong, and where they should go next.
In short, understanding your PnL isn’t just about math. It’s about awareness. Once you start reading it the right way, you’ll see trading differently: less guessing, more learning, and more control over your long-term financial outcome.
8. FAQs: Frequently asked questions about PnL in trading
Beginners often ask what P&L is in a trading strategy. Simply put, PnL stands for Profit and Loss. It measures how much money you’ve made or lost from your trades. Think of it as your trading report card; it shows your results over time.
The basic formula is (Exit – Entry) × Position Size. That’s your raw PnL, but remember to include transaction costs and margin requirements, which affect your true results.
There isn’t a universal answer, but most consistent traders aim for a reward-to-risk ratio of at least 2:1. This means they expect to make twice as much profit as what they risk per trade.
It’s the potential profit or loss on open positions that haven’t been closed yet. Because prices keep changing, this number moves constantly with market value shifts.
Realised PnL refers to the profit or loss you’ve locked in after closing your trade. It reflects your confirmed performance, which can later appear in your income statement if you trade professionally or in investment banking.
In forex, PnL measures how much your currency positions have gained or lost. Since forex trades are often leveraged, small price moves can lead to large PnL swings. That’s why risk control is crucial.
In general finance, PnL represents the net result of income and expenses within a business. It’s what you’ll see in a company’s profit and loss statement, also called an income statement.
Yes, it does. Taxes on gains apply when you sell an asset for more than you paid. If you trade actively, it becomes part of your bottom line.
Most major platforms display PnL in real time, especially when you use leverage on these platforms.
Beyond PnL, track key stats such as win rate, average return per trade, and drawdown. Together, these help build a full picture of your performance and risk management.
Absolutely. Leverage amplifies both profit and loss. Used wisely, it can increase returns. Used poorly, it can quickly wipe out your account.
By reviewing your PnL reports, you can identify patterns in winning and losing trades, refine entries and exits, and improve your strategy over time.
Margin is the amount of capital you must hold to open or maintain a trade. When prices move against you, your PnL drops and may trigger a margin call if losses exceed your available balance.
Yes. If the market moves against your open position and you close it at a loss, your unrealised PnL instantly becomes a realised loss.
PnL changes with market fluctuations, liquidity, and volatility. The more active the market, the faster your PnL will update, especially on leveraged trading platforms.
9. Conclusion
So, what is PnL in trading? It’s more than just a profit or loss number on the screen. It’s a trading story, one that reflects discipline, decision-making, and growth. Whether you manage a small account or an investment portfolio, understanding Profit and Loss (PnL) shows what’s working and what needs adjustment.
At H2T Funding, we always remind traders that PnL is the foundation of every successful strategy. When you know how to calculate, read, and learn from your PnL, you gain control over your performance instead of letting emotions lead the way. Every trade becomes a lesson, not just a result.
If you’re looking to build consistency and confidence in your trades, explore more insights from our Prop Firm & Trading Strategies category. Learn how professional traders manage risk, refine their systems, and use PnL data to trade smarter, not harder.