If you’ve ever looked at a chaotic trading screen filled with flashing numbers and wondered, What is level 2 in trading? Or specifically, what is level 2 in day trading? You are already thinking like a professional. While most beginners focus only on price charts, there is an entire layer of hidden order flow driving those moves.
This guide, H2T Funding, will walk you through exactly how the order book works, how it differs from basic quotes, and why it is such a powerful tool for serious stock and futures traders. Ready to see what the smart money is doing? Let’s get started.
Key takeaways:
- What is level 2 in trading? Level 2 trading data shows the full list of buy and sell orders, not just the best bid and ask.
- It helps you see market depth, liquidity, and real-time order flow behind price movements.
- Understanding Level 2 lets you anticipate price changes instead of reacting to them.
- It’s essential for day traders and scalpers who rely on speed, timing, and precision.
- Combining Level 2 with Time & Sales provides a clearer view of true market activity.
- Mastering Level 2 builds confidence, sharper entries, and smarter trade decisions.
1. What is level 2 in trading?
Level 2, also frequently referred to as the Order Book, Market Depth, or Order Flow Data, is a real–time stock data feed that shows the full list of buy and sell orders for a particular stock, future, or other instrument. It is commonly called the order book because it displays all the specific bids and asks submitted by traders, brokers, and market makers.

Unlike Level 1, which only shows the best bid and best ask, Level 2 goes deeper. It shows multiple price levels on both sides of the market, giving you a much clearer sense of market depth, liquidity, and overall order flow.
Here’s a simple comparison of how this advanced stock data differs from basic quotes to make it easier to understand:
| Feature | Level 1 | Level 2 |
|---|---|---|
| Data shown | Best bid and ask | Multiple price levels |
| Purpose | Basic quote info | Full market depth |
| Best for | Long-term investors | Active traders and scalpers |
In other words, Level 1 tells you what’s happening right now, while Level 2 helps you understand why it’s happening. It lets you see where big buyers or sellers are lining up, which can give you valuable clues about potential support or resistance levels.
According to Nasdaq, its premier Level 2 feed (TotalView) offers more than 20 times the liquidity depth compared to standard Level 1 quotes. This massive depth of information is why professional day traders integrate it into their trading plan to gauge market sentiment accurately, rather than just guessing based on the last traded price.
2. How level 2 market data works
When I first started trading, I remember staring at the Level II window, completely lost. Rows of numbers, flashing red and green, and I had no clue what any of it meant. If that sounds familiar, don’t worry. Once you understand how Level 2 market data actually works, those numbers start to tell a very clear story about buying and selling pressure in real time.
Level 2 data (sometimes called Level II trading data) works by aggregating pending orders from various exchanges and electronic communication networks (ECNs). Unlike a simple price chart, it provides a granular view where each line of data represents a specific limit order waiting to be executed.
Specifically, the system displays multiple levels of bids and asks, and for each order, it details:
- Price: The exact price at which a trader is willing to buy or sell.
- Size: The number of shares or contracts attached to that order.
- Market Maker/ECN ID: The specific entity (like ARCA, NSDQ, or a bank) handling the order.
This data is streamed in real-time from major providers like NASDAQ TotalView or CME Depth of Market. This is essential for understanding what level 2 data in futures trading is, ensuring you see the market depth exactly as it stands at that millisecond.
Here’s how the flow works step by step:
- Order Entry: Every order from traders, market makers, or algorithms enters the system and forms part of the market’s depth.
- The Stacking: The bid side stacks buyers from the highest price down, while the ask side stacks sellers from the lowest price up.
- Execution: As soon as a match happens when a buyer agrees to a seller’s price, the trade executes, and you’ll often see an instant reaction in price action.
Think of it like a transparent auction. You don’t just hear the current highest bid; you see exactly who is bidding, how much they want, and where the next line of buyers is waiting.
Watching these orders and volumes helps you spot where real liquidity sits, the price levels where large traders, even institutions, are placing their bets, and where open interest tends to build up in the market.
In day trading, reading this flow of Level 2 data is the first step in learning how to be more disciplined in your trading and timing your entries precisely. You can sense momentum building when buyers keep absorbing all the sells, or spot hesitation when the bid prices start thinning out.
So, to sum it up:
- Level 2 market data gives you transparency about what other traders are doing.
- It helps you understand the balance of buying and selling pressure.
- And when used properly, it can help you build the best trading strategy for beginners by allowing you to anticipate price movement before it appears on the chart.
If you ask me, this is what makes Level 2 one of the most powerful tools for serious traders. It’s not magic, but it’s the closest thing we have to seeing the market’s heartbeat in real time.
3. Key components of level 2 quotes
When you first look at a Level 2 screen, it can seem overwhelming. However, the structure is actually quite simple once you break it down. A standard Level 2 window reveals exactly who is buying and selling at specific prices. This offers details that go far deeper than just knowing how to understand trading charts.
Here are the core components you need to know:
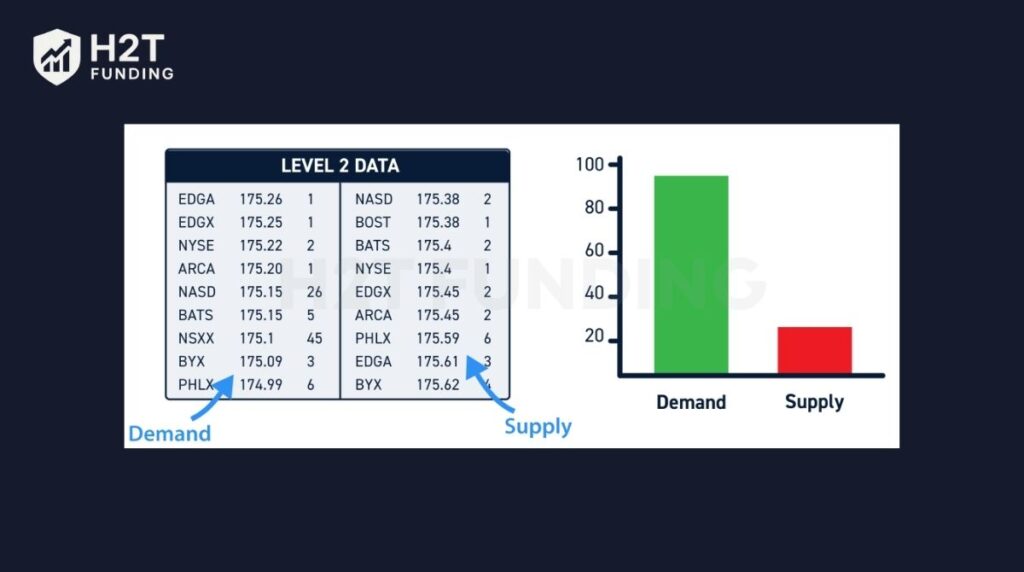
- Bid Side (Green): Displays the list of buyers. These are sorted from the highest price (best bid) at the top down to lower prices.
- Ask Side (Red): Displays the list of sellers. These are sorted from the lowest price (best ask) at the top up to higher prices.
- Size (Volume): Shows the number of shares (for stocks) or contracts (for futures) waiting to be filled at each specific price level.
- Market Maker (MM) / ECN ID: Identifies the source of the order (e.g., NSDQ, ARCA, CME). This tells you whether the liquidity is coming from a major exchange, an electronic network, or a specific market maker.
- Time & Sales (The Tape): Often displayed right next to Level 2. While Level 2 shows intent (pending orders), the Tape shows reality (executed trades). Watching the Tape confirms if the orders on Level 2 are actually getting filled or if they are just “spoofing.”
Quick summary table:
| Component | What It Shows | Why It Matters |
|---|---|---|
| Bid Side (Green) | Buyers | The highest price is on top (best bid). |
| Ask Side (Red) | Sellers | The lowest price is on top (Best Ask). |
| Size | Quantity | Shows the strength of support/resistance. |
| MM/ECN | Source | Tells you who is providing the liquidity. |
| Time & Sales | Real Trades | Confirms if orders are actually executed. |
In short, level 2 trading explained comes down to this: it shows pending orders, while Time & Sales reveals executed trades. Using them together gives you the complete picture, offering a much sharper edge than simply learning how to trade using indicators alone.
4. Why level 2 data matters for traders
I’ve heard this question many times: What does level 2 mean in trading, and is it really worth using? Honestly, once you understand how Level II data works, it changes how you see the market. You stop guessing and start reading what the market participants are actually doing behind every candle.

Here’s why Level 2 data in trading matters so much, especially if you want to trade as professionals do:
- You see what’s really moving the price. Charts show results, but Level 2 shows causes. You can watch real buying and selling pressure build up before a breakout or a reversal. That’s what makes it so powerful in day trading setups.
- You read the market’s mood. When the order book starts to fill with aggressive buyers, it usually means confidence is high. But if large ask prices stack up and sellers keep adding size, it signals hesitation or possible resistance.
- You find key levels before everyone else. By watching Level 2 data in stocks, you can spot support and resistance levels long before they show up on the chart. This helps you plan smarter entries and determine how to calculate lot size in forex or futures based on the available liquidity, instead of just reacting late.
- You confirm real liquidity. Not all market depth is equal. Market makers, wholesalers, and electronic communication networks (ECNs) constantly post and cancel orders, so understanding a broker in trading versus a market maker helps you judge real liquidity and momentum.
- You build confidence in your timing. For me, learning to read Level 2 trading data was like unlocking a hidden map. Once I saw where big players placed their orders, I stopped overthinking and started reacting faster to price action.
Let’s say you’re watching Level 2 data in futures trading on the Nasdaq index. You notice buyers keep stepping in at one price, defending it each time the market dips. That’s a strong clue about how market pressure is shifting between buyers and sellers. Recognizing those reactions gives you a massive edge over traders who rely only on indicators.
So, what is level 2 data in trading? It’s not just another chart tool. It’s a way to see real human behavior: the push and pull between retail traders, institutions, and market makers that actually drive every tick.
In short:
- Level 2 data lets you see the truth behind price movement.
- It sharpens your awareness of liquidity and timing.
- And if you use it right, it can turn uncertainty into confidence.
That’s why so many successful traders say that once you master Level 2, you’ll never look at a chart the same way again.
5. How to interpret level 2 data (step-by-step)
When you first open Level II data, it might look intimidating. Numbers keep changing, colors flash non-stop, and you wonder how anyone can make sense of it. But once you understand the flow, it becomes one of the most useful tools for day trading. Let’s go through how to read it step by step.
5.1. Step 1: Observe the balance between bids and asks
Look at the bid prices (buyers) and ask prices (sellers). If the bid side keeps growing while the ask side gets smaller, buyers are gaining control. This often signals upward price movement. But if sellers keep adding size at multiple price levels, it may mean pressure to the downside.
5.2. Step 2: Read the market depth carefully
The order book tells you how many buy and sell orders sit at each level. Shallow depth can make prices jump quickly, while deep depth with steady liquidity shows a stable market. Watching how orders appear and disappear reveals shifts in supply and demand.
5.3. Step 3: Combine Level 2 with Time & Sales
Many experienced traders compare the order book with Time & Sales data to confirm which orders are real. If you see large bids on Level 2 but no actual trades hitting those prices, they might be fake bids placed to mislead the market. Real trades confirm momentum, while the fake ones usually disappear before being filled.
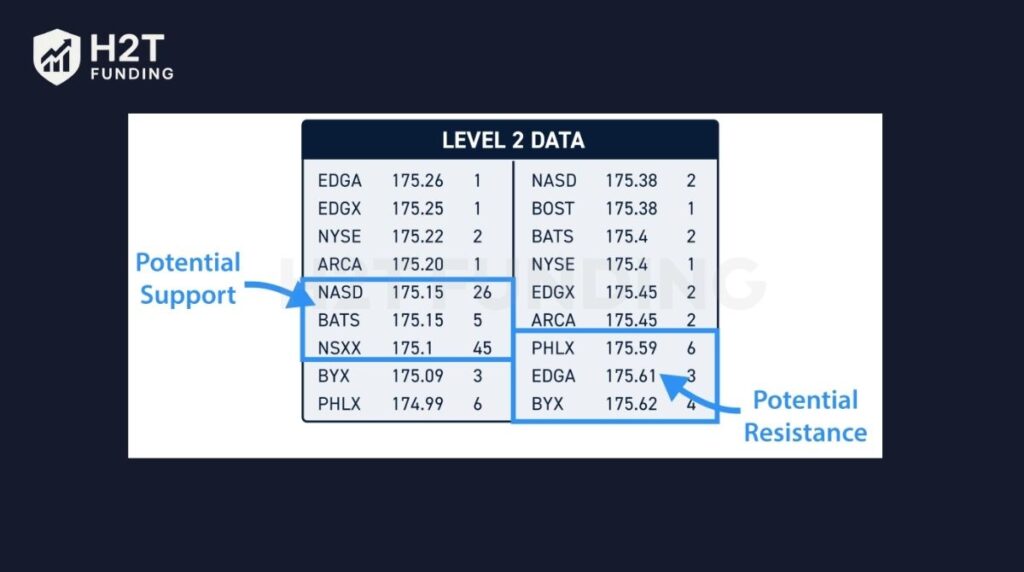
5.4. Step 4: Identify strong areas of interest
Watch for clusters of order sizes where buyers or sellers keep returning. These areas often form natural support levels or resistance levels. When the price approaches those zones, you’ll notice big players defending or attacking them.
5.5. Step 5: Track price reactions during volume spikes
During active day trading, big volume often appears around key levels. If the price moves fast through large sell walls, that means real strength. If it stalls near heavy selling, it could be a short-term top. This simple observation helps refine trading plans in both stocks and futures trading.
5.6. Step 6: Be mindful of market participants
Not all orders come from individual retail traders. Institutional investors, market makers, and electronic communication networks (ECNs) constantly adjust quotes to manage liquidity. Understanding who’s providing those quotes helps you interpret Level 2 data in stocks more accurately.
5.7. Step 7: Spotting Institutional Activity
Big institutions don’t trade like retail traders. Here are two specific patterns to watch for on Level 2:
- Iceberg Orders: If you see small orders constantly refreshing and getting filled at the exact same bid price but the price refuses to drop, it often indicates an institution quietly accumulating a position without alerting the market.
- Spoofing: Be wary of massive orders that appear and vanish suddenly. Sometimes, algorithms place a fake ‘sell wall’ to scare retail traders into selling, only to cancel the order right before the price hits it.
Example:
Let’s say you’re watching Level 2 data in trading for Tesla. You notice 5,000 shares waiting to be bought at $195 and only 500 shares offered at $196. This imbalance suggests buyers are ready to absorb selling pressure, which might push prices higher. But if those big bids suddenly vanish, it’s a sign that momentum could fade.
In short:
- Reading Level 2 trading data is about observing behavior, not memorizing numbers.
- It helps you feel the market’s rhythm and anticipate moves before they appear on the chart.
- For day traders, it’s like having a window into the market’s emotions: fear, greed, hesitation, and conviction.
That’s what makes learning what level 2 data in futures trading or what is level 2 in stock trading so valuable. Once you master it, you start trading with insight, not just intuition.
6. Where to get level 2 market data
If you’re serious about improving your trading decisions, knowing where to get Level 2 market data is just as important as learning how to read it. Where can I actually see all those bids and asks?” or search for what level 2 trading platform best suits their needs. The good news is that several reliable stock data platforms offer it, each suited to different styles like day trading or long-term analysis.
Here’s a quick overview of the best options I’ve used or tested myself:
- NASDAQ TotalView and NYSE OpenBook: These are two of the most comprehensive data feeds available, showing full market depth. However, keep in mind that this professional-grade data is rarely free. For instance, Questrade requires a paid ‘Enhanced Data’ package, while Interactive Brokers charges monthly fees unless you generate enough commissions to waive them.
- Thinkorswim by TD Ameritrade: Ideal for beginners learning about Level 2 data in trading. The interface is user-friendly, updates quickly, and integrates Time & Sales right beside the order book. It’s great if you want to practice reading price action during live sessions.
- Interactive Brokers (IBKR): Known for reliability and low fees. It provides Level 2 trading data across multiple markets, including stocks and futures trading. IBKR is a favorite among experienced retail traders who want transparency without paying premium data costs.
- Tradovate and CenterPoint Securities: If you’re into day trading futures, Tradovate gives clean, fast Level 2 data in stocks and commodities. CenterPoint, on the other hand, caters to more advanced active traders who rely on liquidity and fast execution.
- Robinhood Gold: Some people are surprised, but yes, Robinhood Gold offers Level II through NASDAQ. It’s basic compared to professional tools, but it’s a decent start if you’re still learning what Level 2 is in day trading.
A few notes from experience:
Always check if your broker provides real-time data or delayed feeds. Even a few seconds of delay can distort your view of supply and demand. Paid feeds usually give deeper visibility, while free ones are limited to fewer price levels.
Make sure your internet connection is stable and be aware of latency. For international traders, especially those in Vietnam or Asia, receiving direct real-time data from US brokers can sometimes suffer from lag due to server distance. Additionally, opening US brokerage accounts can be restrictive.
This is why many traders opt for proprietary trading firms, which provide access to professional-grade, low-latency data platforms without the hurdles of opening a personal international brokerage account.
If you’re just starting, my advice is to begin with a platform that shows both Level 2 and Time & Sales. Watching how orders appear and then fill in real time will help you connect what you see on the screen with actual price movement.
Trading is all about reading behavior, and this data gives you the closest look at what’s happening behind the charts. Once you get used to it, you’ll realize how much more control you have when your trades are based on real information instead of guesses.
7. Difference between Level 1 and Level 2 data
If you’re still wondering what level 2 trading data is and how it differs from level 1, think of it this way: Level 1 gives the headline, while Level 2 tells the full story. Most beginners start with Level 1 because it’s straightforward, showing the bid, ask, and last traded price. But once traders explore Level II, they quickly notice the extra layers of detail they’d been missing.
Here’s a simple comparison that makes it clearer:
| Feature | Level 1 | Level 2 |
|---|---|---|
| Data shown | Best Bid, Best Ask, Last Price, & Volume | Full Order Book (Multiple price levels of Bids/Asks) |
| Market view | Basic snapshot (The Tip of the Iceberg) | Deep view of liquidity and market depth |
| Best for | Long-term investors & Swing traders | Active traders, scalpers, or day traders |
| Insight Type | Reactive: Shows what just happened | Predictive: Shows supply/demand intent before it happens |
Level 1 tells you what the price is. Level 2 trading data shows you why the price is moving. When I first switched to Level 2, I noticed patterns I’d never seen before. For example, I could tell when market makers started pulling orders, which often hinted that momentum was about to fade.
If you trade stocks, understanding exactly what level 2 data in stocks can help you see where big buyers are waiting. That’s how you spot support and resistance before everyone else.
In simple terms, Level 1 tells you the current price (reactive), while Level 2 helps you predict where the price is likely to go (predictive). The difference might seem small, but in fast-moving markets, seeing the ‘intent’ of smart money before orders are executed can decide whether you make or lose money.
When you combine both, you get the best of both worlds: the simplicity of Level 1 with the strategic insight of Level 2. And honestly, that’s where trading success really begins.
8. Benefits and limitations of level 2 data
When I first started using Level II, I felt like I had just discovered a secret window into the market. It helped me see things that normal charts couldn’t. But after a while, I also realized it’s not perfect. Like any trading tool, Level 2 data has both strengths and weaknesses. Let’s look at them honestly.
Benefits:
- You see what others can’t. Level 2 gives a clear picture of market depth, showing real buying and selling pressure. You can spot where big players are placing their orders, which helps you understand market behavior better.
- Better timing for entries and exits. Watching the order book helps you know when liquidity is strong or weak. That way, you avoid entering at the wrong time or chasing bad moves.
- A faster read on momentum. When bid prices keep increasing or sellers pull back, you can sense momentum before it appears on your chart.
- Confidence in short-term trades. For those who trade quickly, Level 2 helps confirm if the price is likely to continue or reverse. It’s almost like feeling the rhythm of the market in real time.
Limitations:
- It can be misleading. Some market makers use tactics like spoofed orders or cancel large trades before execution. It looks real but disappears in seconds, confusing new traders.
- Too much information. If you’re not used to reading data, the constant changes can feel overwhelming. I remember my first week staring at the screen, unsure which numbers actually mattered.
- It does not show the full market picture. Level 2 displays only ‘lit liquidity.’ It fails to capture trades occurring in dark pools or hidden ‘iceberg orders,’ which can account for over 40% of institutional volume. This means a price level showing small order sizes on Level 2 might actually be hiding a massive institutional sell order that isn’t visible until it is hit.
- Extra cost. Real-time feeds from exchanges like NASDAQ or NYSE often require monthly subscriptions. It’s a small price for serious traders, but beginners might hesitate.
To put it simply, Level 2 is a powerful tool, but it’s not a crystal ball. It works best when you use it together with price action and good risk management, and learning how to backtest a trading strategy allows you to verify if Level 2 signals truly improve your performance.
I think of it like driving a car. Level 1 is the windshield, showing you what’s ahead. Level 2 is the radar, warning you about what’s moving beneath the surface. You still need both to stay safe and move smart.
9. FAQs about level 2 trading
If you’re an active trader who likes to catch short-term moves, yes, it’s worth it. Level 2 gives you real insight into what other traders are doing. But if you’re just investing long-term, the basic quotes are usually enough.
In options, Level 1 shows only the best bid and ask, while Level 2 reveals multiple price levels and real order flow, helping you gauge contract liquidity better.
You can access it through brokers like Interactive Brokers, Thinkorswim, or NASDAQ TotalView. Some offer it for free; others require a small monthly fee.
Yes. Many modern platforms let you click on bids or asks to place trades instantly. It’s convenient but requires focus, because the market can move fast.
Not always. Some large players hide part of their size to avoid moving the market. You can sometimes spot this when small orders keep refreshing at the same price.
It depends on your learning curve. The first time I used it, I got overwhelmed. But after a few sessions of observation, the data started to make sense. Take your time, practice with a demo, and you’ll get comfortable.
If you trade often or scalp, it can be a big advantage. You’ll see momentum building before the price reacts. But if you prefer swing or long-term trades, Level 1 data usually does the job.
Time & Sales shows executed trades, while Level 2 shows pending orders. Watching both together gives a clearer picture of real market activity.
In Tradovate, Level 1 provides basic quotes for futures, while Level 2 gives a detailed view of the order book and market depth.
It’s a way to look deeper into market activity, seeing where buyers and sellers are lining up. Think of it as reading the crowd’s intentions before they act.
10. Conclusion
In short, what is level 2 in trading? It’s your window into the market’s true behavior, showing where buyers and sellers place their orders and how real momentum builds.
At H2T Funding, we see Level 2 as more than data. It’s a skill that helps traders read price action, control entries, and make smarter decisions.
If you want to sharpen your edge, check out more guides in our Prop Firm & Trading Strategies category. Understanding the flow of the market is how every strong trader begins.