Let’s be honest, most price charts look like chaos. The first time I opened one, I felt stupid. Candles everywhere, lines shooting up and down, no pattern, no meaning. I stared at it for hours, hoping it would suddenly make sense. It didn’t.
Then, like flipping a switch, I stumbled on something that finally made sense: What is a trendline in trading? Not just a line on a chart, but a way to see the market.
A trendline shows you the truth behind the chaos. It reveals direction, momentum, and potential breakouts. Once I understood it, I stopped chasing price and started anticipating it. It changed everything. I stopped gambling. I started trading.
This guide breaks down exactly what is a trendline in trading, why it’s not optional, but essential, and how to use it right now to trade smarter, not harder. If you’re tired of trading blind and ready to trade with purpose, this is where it begins.
Key takeaways
- A trendline is a visual tool that connects swing highs or lows to show market direction, upward (bullish) or downward (bearish).
- It acts as dynamic support or resistance, helping traders identify potential entry, exit, or reversal points.
- Uptrend lines connect higher lows; downtrend lines connect lower highs, both used to confirm who controls the market.
- Two common strategies include trading the bounce (third touch) and breakout (when the price decisively crosses the line).
- Effective only in trending markets, trendlines lose reliability in sideways or choppy conditions and should be combined with other tools for better accuracy.
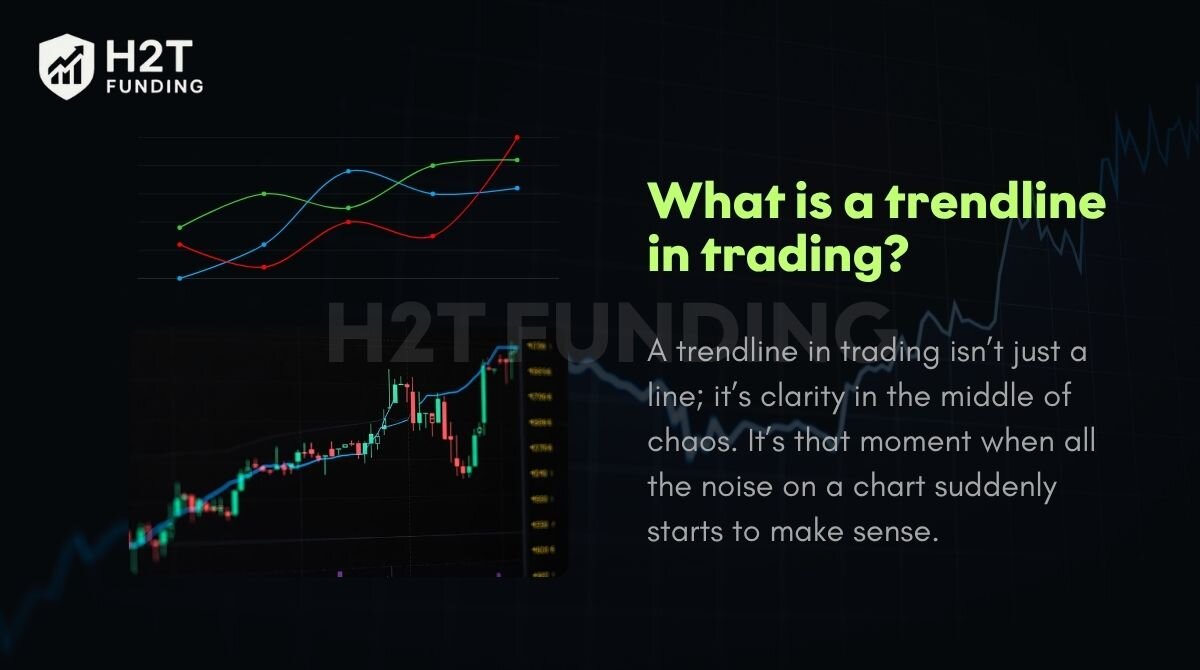
1. What is a trendline in trading?
A trendline in trading is a straight line drawn on a price chart that connects two or more price points and extends into the future to act as a line of support or resistance. It helps traders visualize the direction and strength of a market trend, whether it’s upward (bullish), downward (bearish), or sideways (consolidating).
Picture this: the price is like a ball bouncing up a flight of stairs, chaotic, unpredictable at first glance. Now draw a line connecting the lowest point of each bounce. Suddenly, you’re not just watching the ball bounce. You’re seeing its rhythm, its momentum. As long as it stays above that line, you know it’s still heading upward.
Whether you’re in stocks, forex, or crypto, trendlines help you cut through second-guessing and make decisions based on actual momentum, not emotion. Crucially, it’s the tool that shifts you from nervously reacting to every price tick to confidently anticipating the market’s next likely move.
2. What does a trendline tell you as a trader?
So, you know how to draw a line on a chart. Cool. But be honest, do you really know what that line is telling you?
Because a trendline, when drawn right, is not just decoration. It’s a crystal-clear voice cutting through market noise. It tells you where the price wants to go, where it might turn around, and how long the current momentum can really last. Ignore that signal, and you’re trading blind.
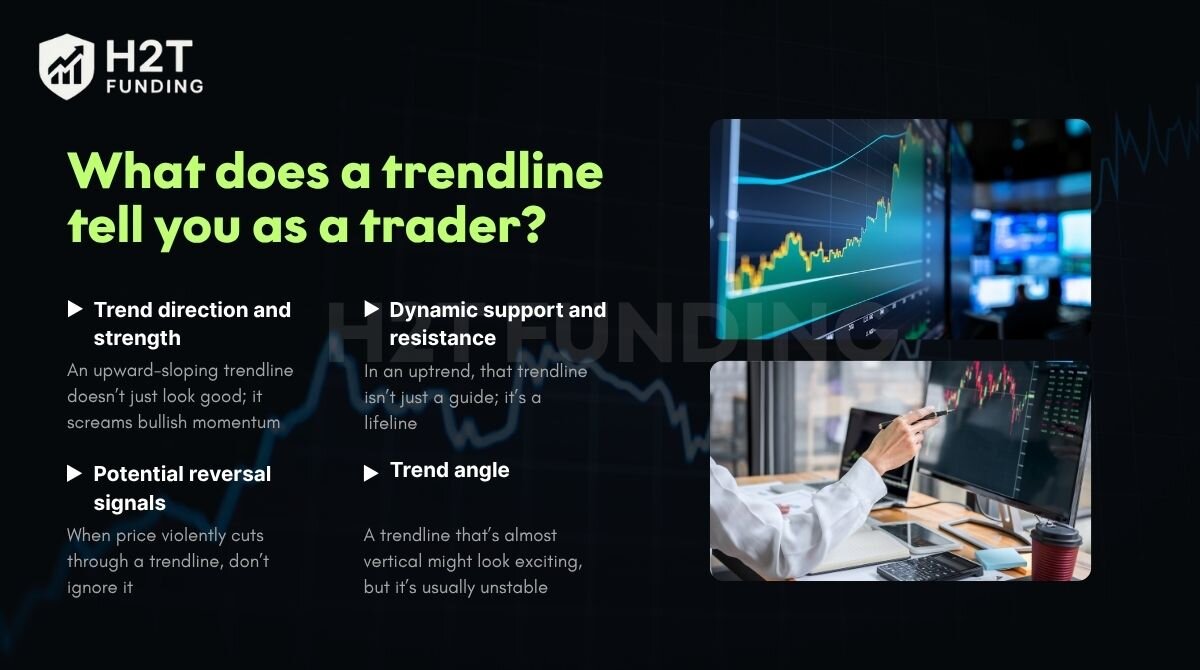
Here’s what a trendline can tell you:
- Trend direction and strength: An upward-sloping trendline doesn’t just look good; it screams bullish momentum. A downward one? It’s flashing red for bears. The steeper the slope, the more aggressive the move, but also the more fragile it can be.
- Dynamic support and resistance: In an uptrend, that trendline isn’t just a guide; it’s a lifeline. Price bounces off it like clockwork. Break it, and the floor gives out. In a downtrend, it becomes the ceiling price can’t seem to break. Respect it, or regret it.
- Potential reversal signals: When price violently cuts through a trendline, don’t ignore it. That’s not noise, that’s a momentum shift. A broken uptrend could be the start of a sell-off. A broken downtrend? A possible breakout.
- Trend angle: A trendline that’s almost vertical might look exciting, but it’s usually unstable. Like sprinting uphill, it can’t last. A gentler slope, on the other hand, often reflects a healthier, more sustainable trend. Smart traders know the difference and act accordingly.
These signals help traders decide whether to enter, hold, or exit a position. While no single tool guarantees accuracy, interpreting trendlines correctly adds another layer of clarity to your trading decisions, a crucial skill if you’re aiming to learn how to pass FTMO challenge.
Discover more related articles:
3. The main types of trend lines
Every trendline has a story to tell, because each one reflects the real heartbeat of the market. And once you learn to read them, you stop feeling like a passive observer and start thinking like a trader with purpose.
There are two essential types that every serious trader must master: the uptrend line and the downtrend line.
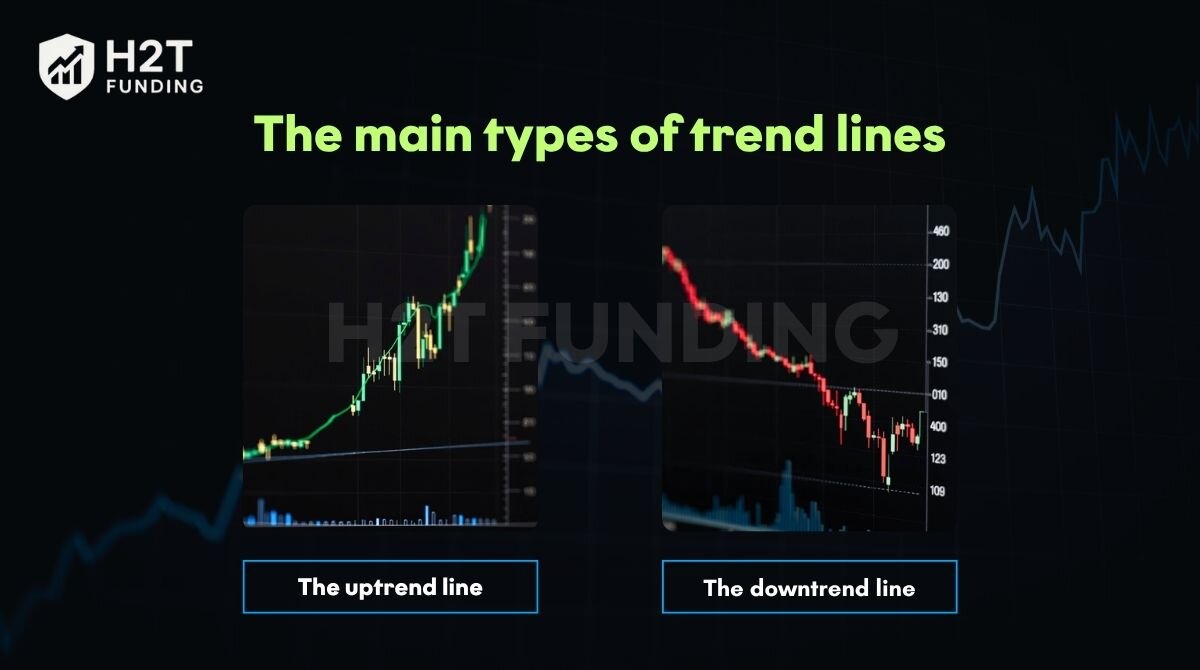
3.1. The uptrend line
You create an uptrend line by connecting at least two (and ideally three) consecutive “higher lows” on a chart. This upward-sloping line acts as dynamic support, clearly showing you that buyers are in control.
For example, imagine this: the price of a currency pair dips a little, just enough to make you doubt, but then rebounds, not just back to where it was, but higher than before. It’s like the market is gathering strength with every pullback, refusing to give in.
When this pattern repeats, something beautiful starts to emerge. Connect those higher lows with a line, and you’ve just drawn an uptrend line, a visual confirmation that buyers are stepping in, again and again, with growing confidence.
An uptrend line is your guide to staying on the right side of the market. Here’s how you can use it:
- Confirm the trend: It gives you visual proof that buyers are still in charge.
- Find high-probability entries: Use pullbacks to the trendline as potential buying opportunities when the market is “on sale.”
- Manage your risk intelligently: Place your stop-loss just below the line. If the price breaks it, you know the trend might be failing, and it’s time to get out.
As long as the price stays above the line and reacts positively to it, the uptrend is considered valid.
3.2. The downtrend line
On the other hand, a downtrend line is drawn by connecting at least two or three lower highs. This line slopes downward and serves as a dynamic resistance level, signaling that sellers are dominating the market.
For instance, in a downtrend, prices may attempt to rise but fail to reach previous highs. Connecting these failure points creates a downtrend line.
A downtrend line shows you that sellers have the upper hand. Use it to:
- Confirm the downward momentum: It’s your visual cue that the path of least resistance is down.
- Pinpoint potential sell zones: Look for the price to rally up to the line and fail. These are often great spots to consider a short entry.
- Protect your capital: Set your stop-loss just above the trendline to define your risk clearly on every trade.
A price that consistently fails to break above the downtrend line suggests that the sellers remain in control, and the trend is still active.
4. How to draw a trendline correctly in 3 simple steps
Drawing a trendline may seem straightforward, but doing it right unlocks real clarity in the chaos. When you connect meaningful price points and see the line hold through multiple tests, it becomes proof that you’re reading the market with purpose and precision. That’s when confidence starts to replace confusion.
4.1. Step 1: Identify at least two major swing points
Start by locating clear swing highs or swing lows on the chart; these are points where the market changes direction noticeably.
- In an uptrend, focus on swing lows (higher lows).
- In a downtrend, focus on swing highs (lower highs).
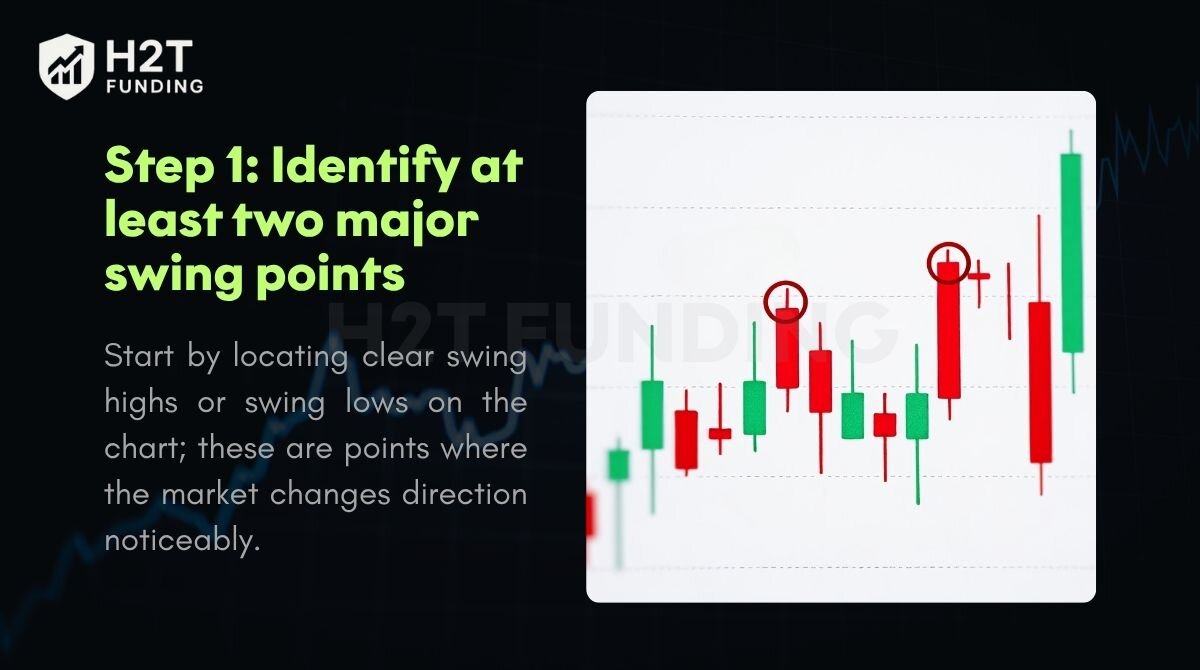
Look at higher timeframes like the 4-hour or daily chart to ensure the points are significant and not just random fluctuations.
4.2. Step 2: Connect the points
Once you’ve locked in two strong points, use your trendline tool to connect them. This is more than just drawing a line; it’s mapping out the market’s rhythm.
- For an uptrend, connect the rising lows.
- For a downtrend, link the falling highs.
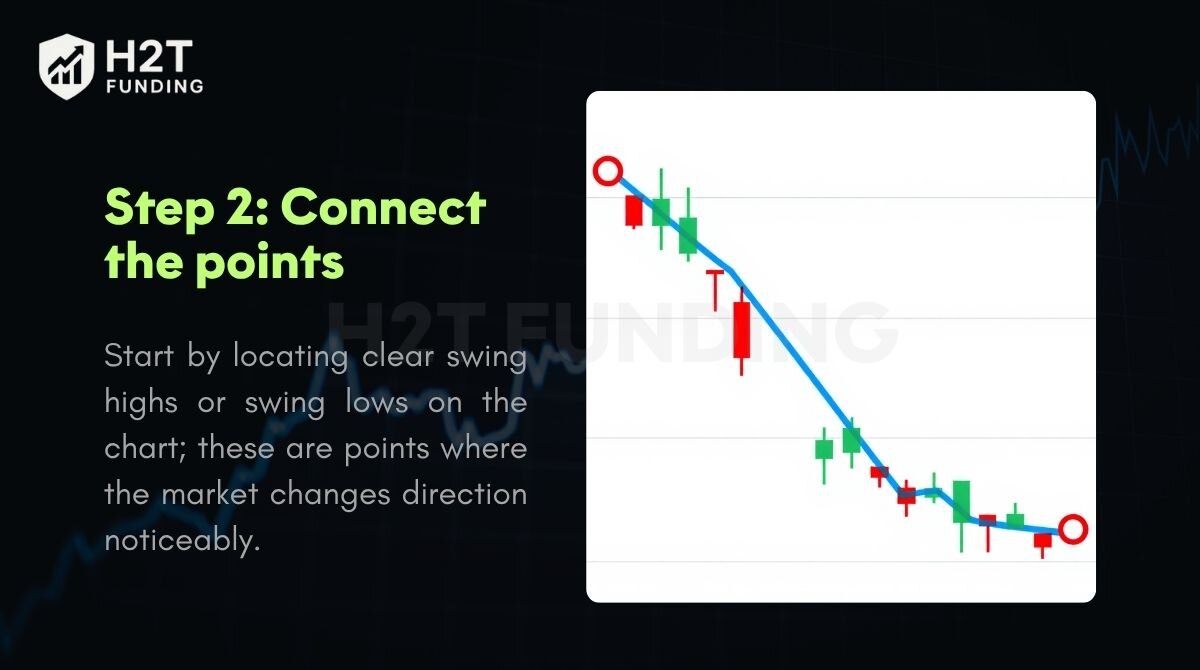
Then, extend the line into the future. That projection isn’t just for show; it’s a powerful reference that helps you anticipate how price may behave. And when you see the price respecting that line later on? That moment is electric. It shows your analysis is working, and it feels incredibly rewarding.
4.3. Step 3: Adjust and validate the line with a third touch
Two points form a line. But three? That’s confirmation. When price touches your trendline a third time and reacts, that’s the market validating your work. It means you’re seeing what other traders are seeing, and that alignment is pure gold.
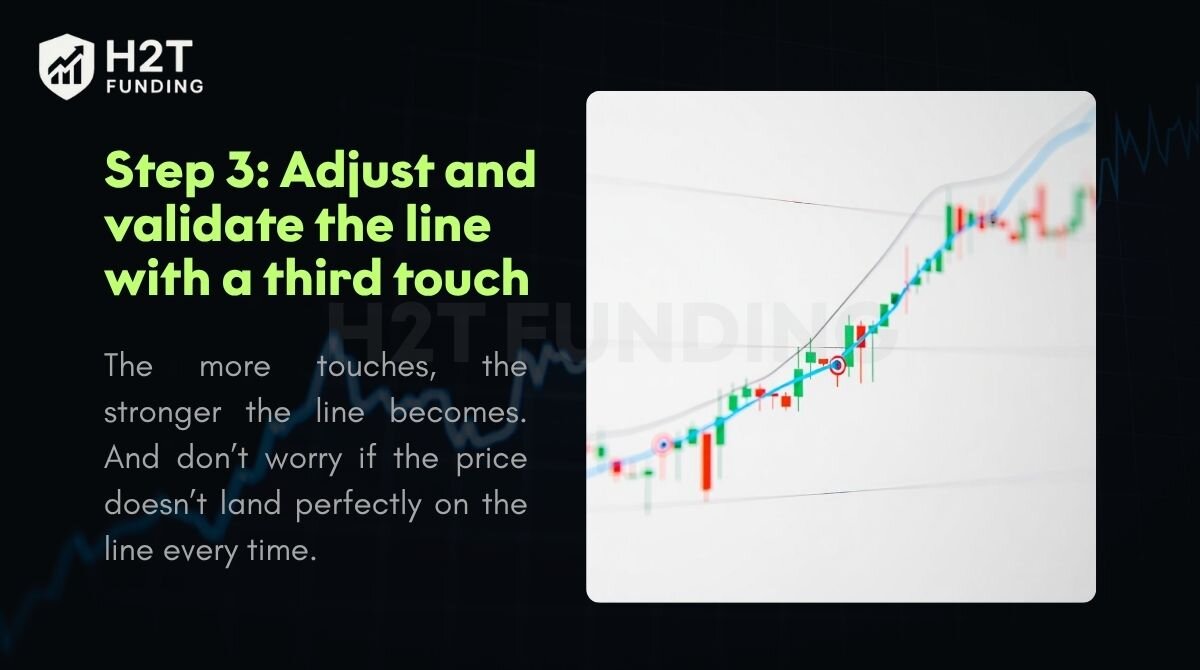
The more touches, the stronger the line becomes. And don’t worry if the price doesn’t land perfectly on the line every time. Slight adjustments are okay, just don’t force it. A great trendline flows with the price, not against it. When it clicks, you’ll feel the difference.
See also:
5. Two popular trendline trading strategies
Once you’ve nailed the art of drawing a proper trendline, it’s time to bring it to life on the battlefield of real trades. Trendlines aren’t just there to make your chart look neat. They’re dynamic, decision-driving tools that can unlock serious trading opportunities.
5.1. Strategy 1: Trading the trendline bounce (the “third touch” rule)
When a trendline has already held strong twice, the third touch isn’t random; it’s your golden opportunity. Markets don’t respect just any line, but when they do, it’s like an unspoken agreement among traders.
And when the price comes back for that third test, it doesn’t just hesitate, it often bounces with confidence, giving you a clear, powerful signal to act.
Here’s the game plan, step-by-step:
- First, identify a strong, valid trendline that the market has clearly respected with at least two touches.
- Next, patience is key. Don’t chase the price. Wait for it to come back to your trendline. This is your “area of interest.”
- Then, look for a confirmation signal before you enter. For a bounce, this could be a bullish candlestick. For a breakout, it’s a strong candle closing decisively past the line.
- Finally, always manage your risk. Place your stop-loss on the opposite side of the trendline, giving your trade a clear point where you know you’re wrong.
Here’s a tip that separates amateurs from pros: Don’t just trade any third touch. Analyze the quality of the candlestick reaction. Are you seeing a powerful rejection candle, like a Pin Bar with a long wick, or a strong Bullish Engulfing pattern right at the trendline? That’s a high-conviction signal. A series of small, weak candles drifting indecisively at the line is a warning that the trend might be exhausted.
5.2. Strategy 2: Trading the trendline breakout
A breakout isn’t just price wandering past a line; it’s the market declaring, Change is here. When a long-standing trendline gets shattered, it’s not subtle. It’s your chance to catch the wave early, right as a new trend takes the lead.
How to execute:
- Identify: Start with a strong trendline that has been respected over time.
- Wait: Look for a decisive candle (e.g., a strong bearish candle in an uptrend) that closes completely on the opposite side of the trendline.
- Enter: Either place a trade immediately after the breakout or wait for a retest, where the price comes back to the broken trendline (now acting as resistance/support).
- Set Stop Loss: Place the stop on the opposite side of the trendline from your entry.
- Check the Volume: When the price breaks through the trendline, look at the trading volume.
- If trading volume is high, it’s like many people agree with the new direction. This makes the breakout signal stronger and more reliable.
- If volume is low, the breakout might be a fake signal. Be careful.
Breakouts often lead to rapid price movement, making this a strategy favored by momentum and swing traders. However, without proper financial planning, even profitable trades might not lead to lasting financial stability. Here’s how to stop living paycheck to paycheck.
6. The difference between trendlines and channels
Trendlines and channels might go hand in hand, but they each bring something unique to your trading arsenal. Both help you make sense of price movement, but they’re not interchangeable. The better you understand these tools, the more confident and strategic your trades become.
| Criteria | Trendline | Channel |
|---|---|---|
| Structure | Single straight line | Two parallel lines (upper and lower boundary) |
| Purpose | Marks a dynamic support or resistance level | Defines the entire price range within a trend |
| Usage | Used to trade bounces or breakouts from the line | Used to trade within the channel (buy at the bottom, sell at the top) or trade breakouts from the range |
While a trendline gives you one edge of the story, support or resistance, a channel reveals the entire playing field. It captures both boundaries of price movement, offering a more complete view of the trend’s rhythm. This simple step can turn a basic chart into a powerful tool for precision entries, exits, and better decision-making.
7. Key limitations and common mistakes to avoid
Trendlines are widely used for a reason; they’re simple, visual, and effective. But like any trading tool, they have limitations. Overconfidence in trendlines or incorrect usage can lead to poor decisions. To make the most of this tool, traders must understand where trendlines fall short and how to avoid common pitfalls.
- Mistake #1: Subjectivity in drawing: No two traders draw trendlines exactly the same. A slight change in swing point selection can alter the line’s angle and meaning. That’s why validation through multiple touches is crucial.
- Mistake #2: False breakouts: Price may temporarily move past a trendline and then return to the trend. These fakeouts can lead to premature exits or losing trades. Always look for confirmation before reacting.
- Mistake #3: Ineffectiveness in sideways markets: Trendlines rely on clear directional movement. In ranging or choppy markets, they become unreliable, leading to noise instead of signals.
- Mistake #4: Treating the trendline as a perfect line: Beginners often make the costly mistake of expecting the price to reverse at the exact pip of their line. They place their stop-loss too close and get taken out by normal market ‘noise’ before the real move happens. Always give your trade a little breathing room around the line.
- Mistake #5: Using only the trendline: Relying on a trendline alone is risky. The best trading signals appear when multiple tools give you the same message. For example, a buy signal is much stronger if the price bounces off an uptrend line and a key moving average at the same time.
- Mistake #6: Using trendlines in the wrong market: Trendlines work best when the market has a clear direction. When the market is moving sideways with no clear direction, trendlines don’t work well and can be misleading. In these cases, it’s better to draw horizontal lines to identify support and resistance.
Being aware of these limitations helps you use trendlines more responsibly. Never rely on them alone. Combine trendlines with other indicators, such as RSI or volume, and always have a solid risk management plan in place.
Do you need to know: What is a trading plan? Build yours in 7 easy steps
8. Frequently asked questions about trendlines (FAQs)
Trendlines work by providing a visual reference for the current market trend. In an uptrend, they act as a dynamic support level where the price tends to bounce. In a downtrend, they act as dynamic resistance, where the price often gets rejected. Traders use these levels to anticipate entry and exit points.
Use a trendline when the market shows clear directional movement, either upward or downward. They’re most reliable on higher timeframes like the 4-hour (H4) or daily (D1) charts. Avoid using them in choppy, sideways markets where the price lacks structure.
In the stock market, a trendline functions the same way as in forex or crypto. It connects key price points on a stock chart to highlight the direction of the trend. Traders use it to identify support and resistance levels, as well as to time their entries and exits more effectively.
A trendline tells you the direction, strength, and structure of a trend. It helps you understand whether buyers or sellers are in control and where the price might react. If the price respects the line repeatedly, it’s a strong sign that the market views it as a key level.
A valid trendline should: Connect at least two significant swing points (ideally three). Be tested multiple times by price. Align naturally with market structure (not forced to fit). More touches equal more reliability. A trendline that hasn’t been tested at least three times is considered hypothetical, not confirmed.
No, trendlines are most effective in trending markets. In ranging or sideways conditions, price moves erratically and often ignores trendlines. In such cases, support/resistance zones or oscillators like RSI might be more useful.
To backtest a trendline strategy: Use historical charts with visible trends. Draw trendlines using past swing points without looking ahead. Apply a clear entry/exit strategy (e.g., bounce or breakout). Track win/loss ratios, risk/reward, and number of fakeouts. Consider using tools like TradingView’s replay mode to simulate real-time conditions more accurately.
Yes, professional traders regularly use trend lines as part of their technical analysis toolkit. While they may combine them with advanced indicators or price action strategies, trend lines remain a foundational tool for identifying trend direction, support and resistance zones, and breakout opportunities.
9. Conclusion
Mastering what is a trendline in trading is more than just learning a technique; it’s about learning to read the market’s story. You now have the framework to identify trends, find smarter entry and exit points, and trade with more confidence. This simple line on a chart is truly one of the most foundational skills in your trading arsenal.
But this is just the beginning. Now that you have a solid foundation, the next step is to learn how to combine trendlines with other powerful tools to build a robust and data-driven trading system.
Explore advanced strategies, risk management techniques, and real case studies inside Prop Firm & Trading Strategies section at H2T Funding. There, you’ll learn how to combine trendlines with other indicators to build a more robust, data-driven trading system.