When evaluating investments, we’ve all been tempted by the allure of a high return. A fund boasting 50% gains is hard to ignore. But as an investor or trader, H2T Funding learned that the number on the surface rarely tells the whole story. This brings us to a fundamental metric I use in all my analysis: the Sharpe ratio.
This simple tool measures risk-adjusted performance, which raises the most important question: What is a good Sharpe ratio? The answer isn’t a single number. A ratio that looks strong for a stock portfolio could be considered merely average for a hedge fund. This guide will demystify the concept and provide the clear benchmarks you need to start making smarter investment decisions.
Key takeaways:
- What is a good Sharpe ratio? A Sharpe ratio of 1.0 or higher is generally considered a good investment, indicating that returns adequately compensate for the risk taken.
- Ratios climbing towards 2.0 and 3.0 are considered very good to excellent, showing superior risk-adjusted performance.
- Context is everything; a “good Sharpe ratio” varies significantly across stocks, hedge funds, or cryptocurrency.
- The Sharpe ratio measures return adjusted for risk, but it is not a magic bullet. It has limitations and should be used alongside other financial metrics.
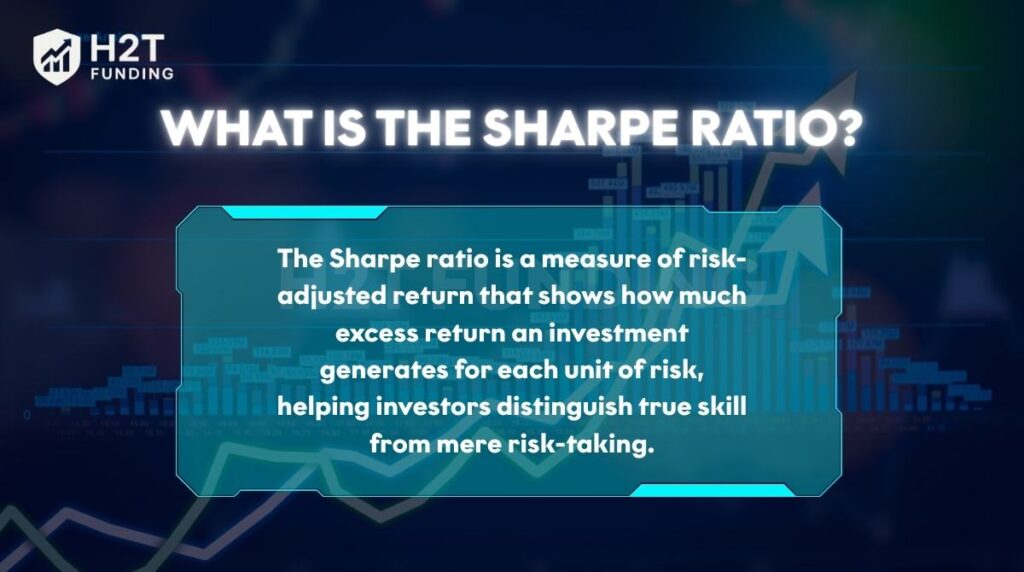
1. What is the Sharpe Ratio?
The Sharpe ratio is a fundamental metric that answers a key question: are your returns from a smart strategy, or just from taking on a lot of risk? This is the essence of what the Sharpe ratio is in investing. It quantifies your excess return for every unit of risk you endure, separating skillful performance from pure luck.
This is why it’s invaluable for comparing different investments on an equal footing. You can use it to see if a mutual fund’s dazzling returns are truly skillful, or if your trading strategy is more efficient than another.
Imagine you have to choose between two traders:
- Trader A: Made a 30% return last year, but their equity curve looked like a rollercoaster, with wild swings in the underlying market price.
- Trader B: Made a 15% return last year, but with slow, steady, and consistent growth.
Just looking at the returns, Trader A seems superior. However, the Sharpe ratio would almost certainly show that Trader B was the smarter choice. This is because the quality of their return was much higher for the low amount of risk involved. It helps you see beyond the headline number.
2. Sharpe Ratio Formula
The calculation is straightforward. You take the portfolio’s return, subtract the return you could have gotten risk-free, and divide that by the portfolio’s volatility.
Sharpe Ratio = (Rp – Rf) / σp
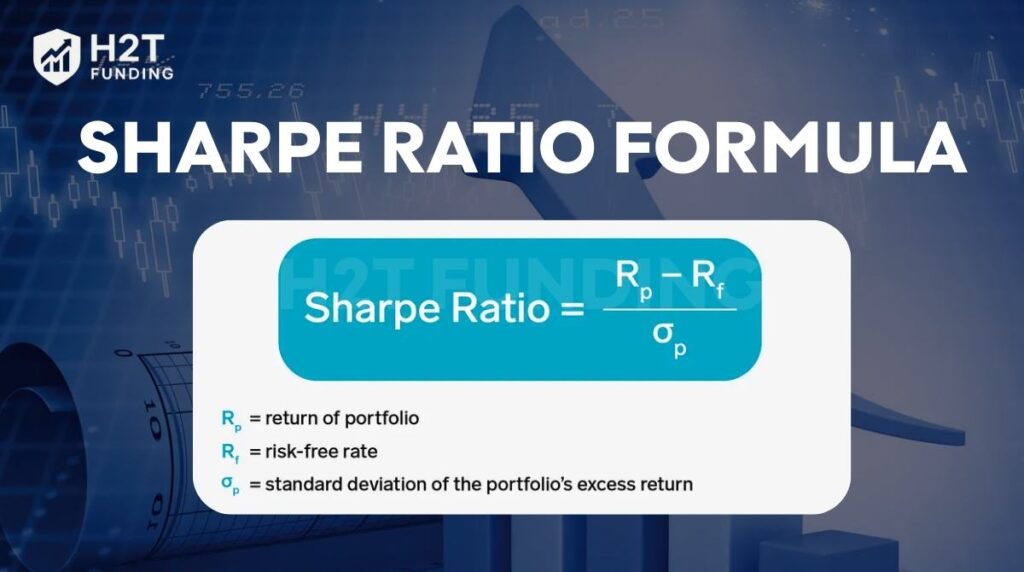
Where:
- Rp: The portfolio’s historical or expected return. Many analysts use forecasted returns for this variable when building predictive models
- Rf: The risk-free rate. Think of this as the return on a U.S. Treasury bill, the closest thing to a guaranteed return.
- σp: The standard deviation of the portfolio’s return, which is the standard measure for its volatility.
Think of the top part of the formula, (Rp – Rf), as the excess return. It’s the reward you get for bravely stepping away from the safety of a guaranteed investment.
3. What is a good Sharpe ratio?
So, let’s tackle the core questions head-on: what’s a good Sharpe ratio? And what is considered a good Sharpe ratio by professionals? While the “right” number depends on your goals, our baseline when analyzing any new strategy is whether its Sharpe ratio is over 1.0.
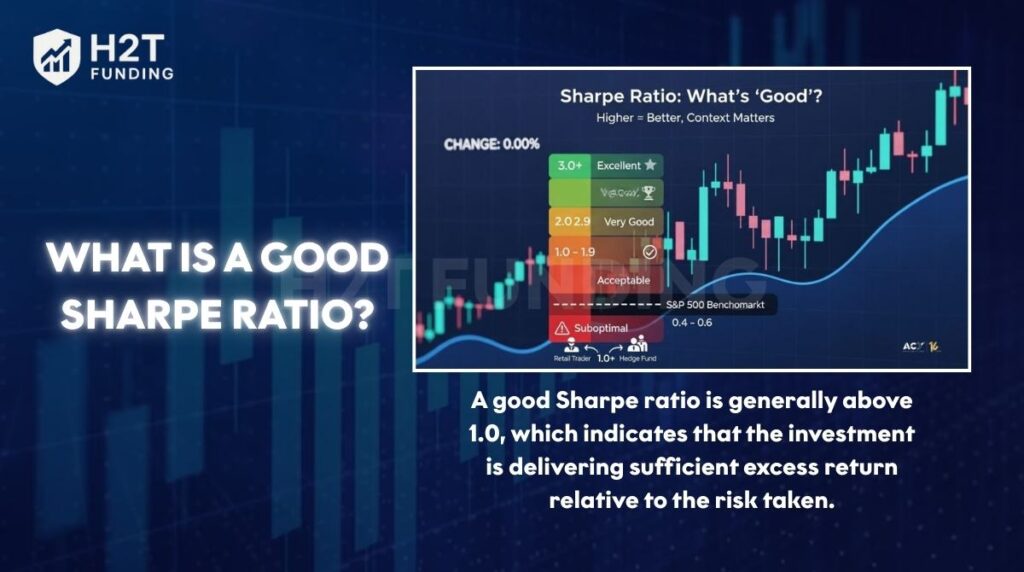
A ratio of 1.0 is the key threshold for a good performance. Anything below that tells me the investment is not adequately rewarding me for the risk I’m taking.
4. Sharpe ratio levels and their meaning
Here’s a simple cheat sheet for interpreting Sharpe ratios:
| Sharpe Ratio | Interpretation |
|---|---|
| < 1.0 | Sub-optimal / Poor |
| 1.0 – 1.99 | Good / Acceptable |
| 2.0 – 2.99 | Very Good |
| > 3.0 | Excellent |
Conversely, a positive Sharpe ratio indicates that you were, at the very least, rewarded for the risk you took on. A negative Sharpe ratio, however, is a huge red flag. It means your investment performed worse than a lower-risk asset like a Treasury bill in trading; that’s an unforgivable outcome.
5. Is a higher Sharpe ratio better?
In 99% of cases, yes. When asking what Sharpe ratio is good, a higher number almost always points to a more efficient and skilled strategy. If Fund A has a Sharpe of 1.5 and Fund B has a 0.8, Fund A is objectively better at balancing risk and reward.
But here’s where experience comes in. I’ve learned the hard way that you should always be skeptical of an unusually high ratio (say, above 3.0 or 4.0). It doesn’t always mean genius is at work. It could be a red flag that the manager is using excessive leverage or, in worst cases, that the performance data has been manipulated. Always dig deeper.
6. Sharpe Ratio benchmark by asset/fund type
What is a good Sharpe ratio varies significantly depending on the market and asset class. A ratio that is excellent for one type of investment might be mediocre for another.
- Stocks (S&P 500 long-term): Historically, the S&P 500 has had a long-term Sharpe ratio of around 0.5 to 0.7.
- Bonds: Bond portfolios typically exhibit lower volatility and lower returns, resulting in Sharpe ratios that are often in the 0.2 to 0.4 range.
- Hedge funds: Due to their use of complex strategies, risk management techniques, and diversification, a good hedge fund often targets a Sharpe ratio of 1.0 to 2.0. An excellent hedge fund may aim for a ratio of 2.0 or higher over a significant period.
- Crypto trading: The cryptocurrency market is known for its extreme market volatility. While this can lead to very high returns, the risk is also substantial. A crypto portfolio might achieve a high Sharpe ratio, but this must be weighed against the potential for massive drawdowns.
- Prop trading: Professional proprietary trading firms often set a high bar, with a target Sharpe ratio frequently above 2.0.
7. Real-life examples: Featured funds and strategies
To truly understand what a good Sharpe ratio is for a fund, let’s consider a practical application. An investor is evaluating two mutual funds:
- Fund A has a Sharpe ratio of 1.8. This suggests a stable and strong performance, generating a good amount of return for the risk involved.
- Fund B has a Sharpe ratio of 1.1. So, what is a good Sharpe ratio for a mutual fund in this scenario? Clearly, Fund A’s 1.8 is superior, as it is far more efficient at generating risk-adjusted returns.
Now, let’s look at a crypto trader who claims a Sharpe ratio of 3.5. While this number is excellent, an investor should be cautious. This could be the result of a short and favorable investment horizon. A deeper dive is necessary to understand if this performance is sustainable. Is it the product of a short-term lucky streak, perhaps using aggressive technical analysis in a favorable market?
A classic case study is comparing the S&P 500 to a hedge fund. The S&P 500 might have a Sharpe ratio of 0.6, while a well-managed hedge fund might have 1.5. This directly answers what is a good Sharpe ratio is for a hedge fund: it must be significantly better than the passive market, proving its effectiveness at balancing risk and reward.
8. Sharpe Ratio vs other metrics
The Sharpe ratio is a foundational tool, but no professional relies on just one. Here’s how it fits into the broader toolkit for performance analysis:
- Sortino ratio: A key weakness of the Sharpe ratio is that it penalizes all volatility, even positive swings. If you’re like me and only care about the “bad” volatility (downside risk), the Sortino ratio is a fantastic alternative. It focuses only on protecting you from losses.
- Calmar ratio: If you’re someone who loses sleep over drawdowns (the painful drop from a peak to a trough), the Calmar ratio is for you. It’s especially useful in risk management to see how quickly an investment recovers from its worst periods.
9. Limitations and notes when using the Sharpe Ratio
The Sharpe ratio is powerful, but it’s not perfect. Here are some limitations you must keep in mind:
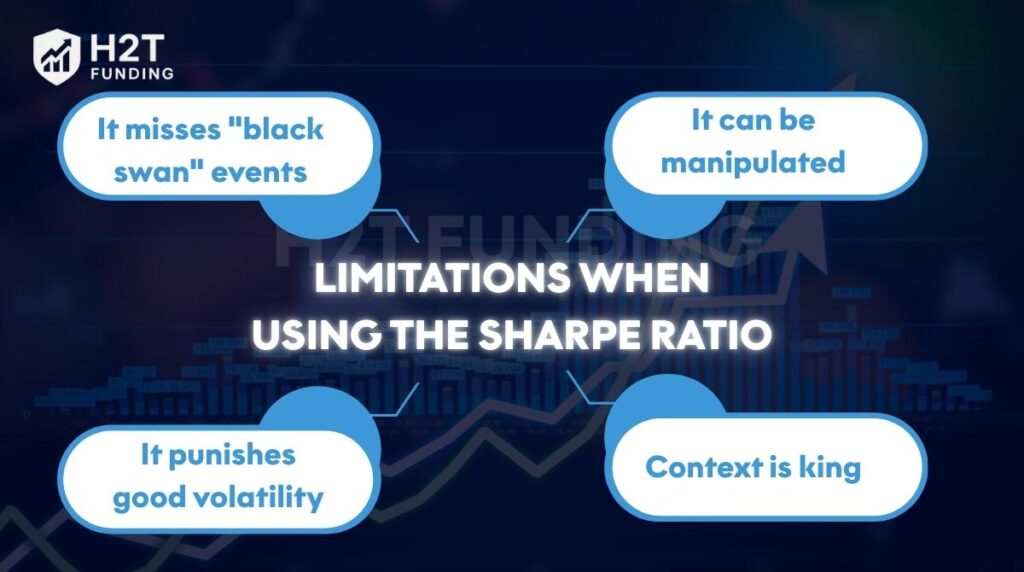
- It misses “black swan” events: The formula assumes returns are somewhat normally distributed. It’s not great at accounting for sudden, rare market crashes that can wipe out a poorly managed portfolio.
- It can be manipulated: A fund can make its Sharpe ratio look better by cherry-picking a favorable start date or by lengthening the measurement period to smooth out volatility.
- It punishes good volatility: A strategy that has massive upward spikes in price will be penalized for that volatility, even though it’s the kind of “problem” we’d all love to have.
- Context is king: A Sharpe ratio of 1.2 is meaningless in a vacuum. Is that good? For a bond fund, it’s amazing. For an aggressive crypto strategy, it might be mediocre. Always compare it to its peers.
10. FAQs
A higher Sharpe ratio is generally better, as it indicates better performance for the amount of risk taken.
For hedge funds, a Sharpe ratio above 1.0 is considered good, and a ratio of 2.0 or higher is considered excellent.
Yes, a Sharpe ratio of 2.0 is considered very good. It suggests a high level of return for each unit of risk.
A Sharpe ratio below 1.0 is generally considered sub-optimal. A negative Sharpe ratio is particularly bad, as it means the investment’s return was less than the risk-free rate.
The long-term historical Sharpe ratio for the S&P 500 is approximately 0.5 to 0.7. However, this can vary based on the time period measured.
Mostly, yes. However, an extremely high ratio could be a red flag for risky behaviors like excessive leverage or manipulated reporting. Always investigate the underlying investment strategy.
In active trading, especially in volatile markets like crypto, a higher Sharpe ratio is sought. While benchmarks vary, a successful trading strategy would aim for a ratio well above 1.0, with professional traders often targeting 2.0 or more.
A Sharpe ratio of 3.0 or higher is widely considered to be excellent.
The Sharpe ratio uses total volatility (both upside and downside) as its risk measure. The Sortino ratio is a variation that only considers downside volatility, which many investors see as a more accurate measure of an investment’s risk of loss.
11. Conclusion
Ultimately, understanding what is a good Sharpe ratio is a game-changer for any investor. It shifts your focus from chasing high returns to demanding quality, risk-adjusted performance. While a ratio above 1.0 is a solid benchmark, the real insight comes from using it to compare similar strategies and understanding the context behind the numbers.
In the world of professional trading, these principles are not just theoretical; they are the foundation of a successful career. Proprietary trading firms and elite traders don’t just seek profit; they demand consistency and superior risk-adjusted returns. A high Sharpe ratio is the hallmark of a disciplined and effective strategy that delivers these results.
Are you ready to see these high-performance strategies in action? Or perhaps you’re a trader aspiring to reach that professional standard? If so, we invite you to check out our Prop Firm & Trading Strategies category of H2T Funding. There, you can explore the methodologies and discipline required to build a track record defined by excellent risk-adjusted returns.