If you are asking what are the best indicators for day trading are, the answer is simple: tools tracking volume and price action like VWAP and Moving Averages. Many novices clutter their screens with lagging lines, which often leads to confusion. At H2T Funding, our goal is to help you cut through this noise and discover the best indicators for day trading beginners.
Relying on a single line on your screen is a quick way to lose money. Indicators only interpret past market behavior and cannot predict future news events. By keeping your setup clean, you can avoid emotional decision-making and focus on real market trends.
Key takeaways
- The most successful professionals use minimal overlays to avoid analysis paralysis.
- Tools like VWAP show the true conviction behind a market move.
- Technical overlays only provide context for support levels and resistance levels.
- Always prioritize how the actual price moves before looking at secondary data.
1. What are the best indicators for day trading? The top 5 core tools
When people ask what the best technical indicators for day trading are, the answer lies in a select few reliable tools. You do not need twenty lines on your chart.
The top choices focus on volume, momentum, and volatility to confirm what the market is doing. Here are the core five that professionals rely on.
1.1. Volume-Weighted Average Price (VWAP)
VWAP is often considered one of the most important tools for intraday trading, especially among institutional traders. It shows the true average price an asset has traded at, factoring in both volume and price. This makes it one of the most used indicators for day trading among professionals.
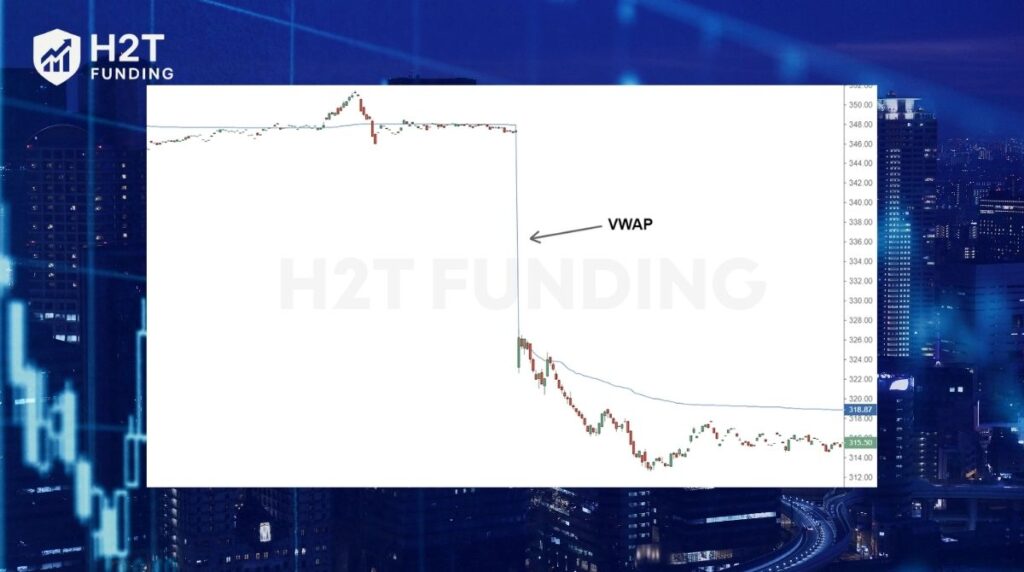
Unlike a standard moving average, VWAP resets every day. It acts as a powerful guide for the daily price trend. If the market is trending strongly, VWAP acts as solid support. On choppy days, it behaves like a magnet, pulling prices back to the average.
1.2. Relative Strength Index (RSI)
The Relative Strength Index (RSI) is a widely respected oscillator that measures the speed and magnitude of price changes. It evaluates market momentum on a scale from zero to one hundred.
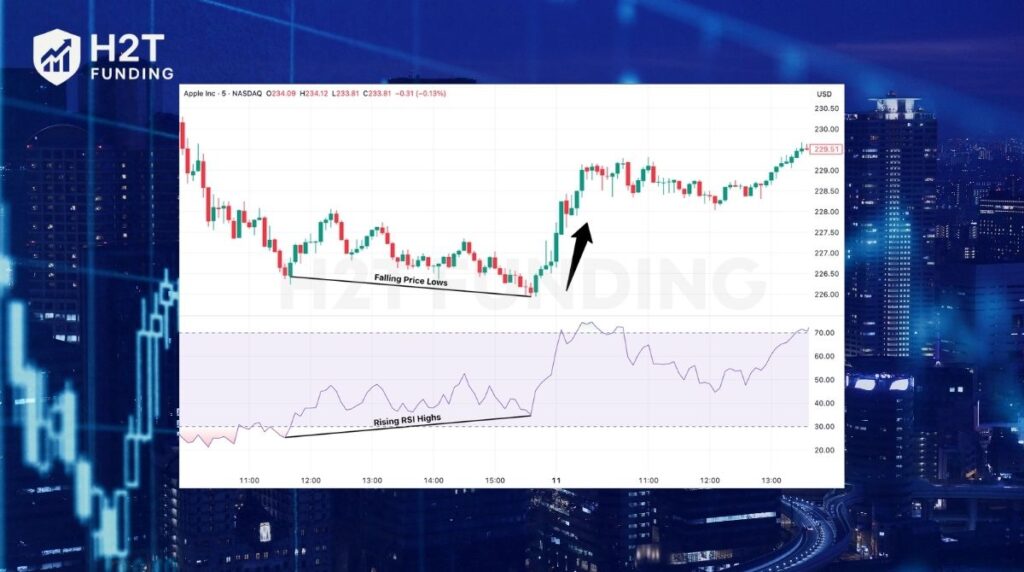
Traders generally consider a reading above 70 as overbought, suggesting a potential pullback. Conversely, a reading below 30 is viewed as oversold. Because it quickly highlights exhaustion in buying or selling pressure, it remains one of the consistently good indicators for day trading.
1.3. Moving Average Convergence Divergence (MACD)
The MACD is a powerful tool built around moving averages and a histogram. Combining it with knowledge of a trendline in trading will help you confirm the market direction more accurately. It is highly valued for trend confirmation and spotting early changes in market direction.
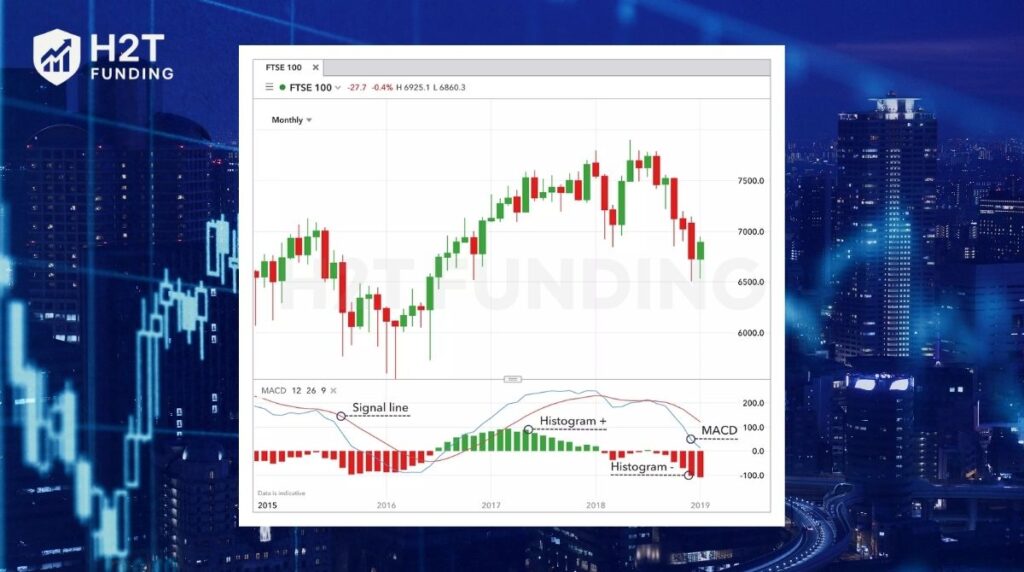
By watching the MACD line cross the signal line, you can identify a clear momentum shift before a major move happens. This ability to show whether a trend is strengthening or weakening makes it one of the most important indicators for day trading.
1.4. Bollinger Bands
Bollinger bands consist of a simple line sandwiched between an upper and lower band. These bands are calculated using standard deviations from a moving average (typically a 20-period Simple Moving Average). They are excellent for measuring market volatility.
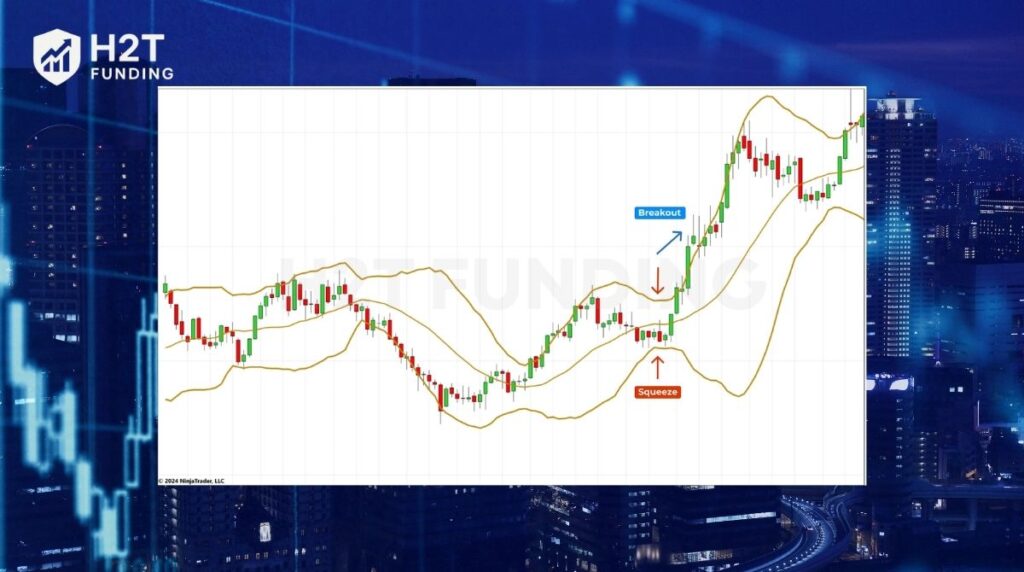
When the market is quiet, the bands contract tightly together. When prices break outside a standard deviation band, it often signals an extreme move. Many traders use these visual boundaries to find the best indicators for day trading buy and sell setups.
1.5. Stochastic Oscillator
The Stochastic oscillator is another momentum tool, but it operates differently from the RSI. It compares an asset’s closing price to its recent price range over a specific period. Readings above 80 signal overbought conditions, while readings below 20 indicate oversold levels.
Because it is highly sensitive to recent price action, it is excellent for spotting short-term reversals. This sensitivity is why many consider it among the best indicators to use for day trading.
In summary, you do not need a complex chart to be profitable. By mastering just a few of these core tools, you can accurately read volume, volatility, and momentum. A clean, focused setup is the foundation of consistent intraday success.
2. Categorizing the best technical indicators for day trading by asset & skill level
The best technical indicators for day trading are categorized based on the asset’s volatility and your level of expertise. Instead of using a one-size-fits-all strategy, beginners should focus on noise-reduction tools like Moving Averages, while crypto traders need broader volatility tools like the Ichimoku Cloud.
2.1. Best indicators for day trading beginners
The best indicators for day trading beginners are always the simplest ones. Before adding complex systems, you should take the time to learn how to understand trading charts.
A basic moving average combined with VWAP is usually enough. This clean approach provides excellent noise reduction. It allows you to see the real trend without getting distracted by tiny fluctuations. The goal is to build your confidence before adding more tools to your screen.
2.2. What are the best indicators for day trading crypto and bitcoin?
When figuring out what the best indicators are for day trading crypto, you must account for extreme volatility. Crypto assets can easily break past a normal standard deviation, so broad tools are necessary. Therefore, the best indicators for day trading Bitcoin must handle these wild price movements.
The Ichimoku cloud is an excellent choice for this fast market. It provides a wide view of the trend and helps identify a sudden liquidity sweep. It can help traders better understand the trend structure and potential support and resistance zones when the market reverses to clear out stops.
2.3. Top tools for intraday buy and sell signals
Finding reliable entry and exit points requires measuring actual trend strength. Many traders use the Average Directional Index (ADX) for this exact purpose. A higher ADX reading suggests a stronger trend, which may increase the probability of a successful setup.
You must also monitor the closing price to ensure a true breakout has occurred. Once confirmed, you can look for overbought or oversold conditions to time your entries. A precise calculation of these levels helps you execute accurate buy and sell orders.
In conclusion, deciding exactly what the best indicators are to use for day trading depends on your experience. You must adjust your tools to fit different market regimes. A good setup always includes a reliable volatility filter to keep you out of choppy waters.
3. How to combine good indicators for day trading (The no-noise strategy)
Combining tools requires a strict “No-Noise” rule where you never mix overlapping signals on your screen. The best approach is pairing one trend tool with one momentum tool, then executing your plan flawlessly. A cluttered screen leads to hesitation, while a clean setup builds confidence.
3.1. The rule of three
Keep your chart clean by using a maximum of three tools at any given time. Crucially, never use tools from the exact same category simultaneously. For example, placing both the RSI and the Stochastic on your screen is highly redundant. They both measure momentum and will give you very similar data. This overlap only creates visual clutter and causes hesitation during fast market moves.
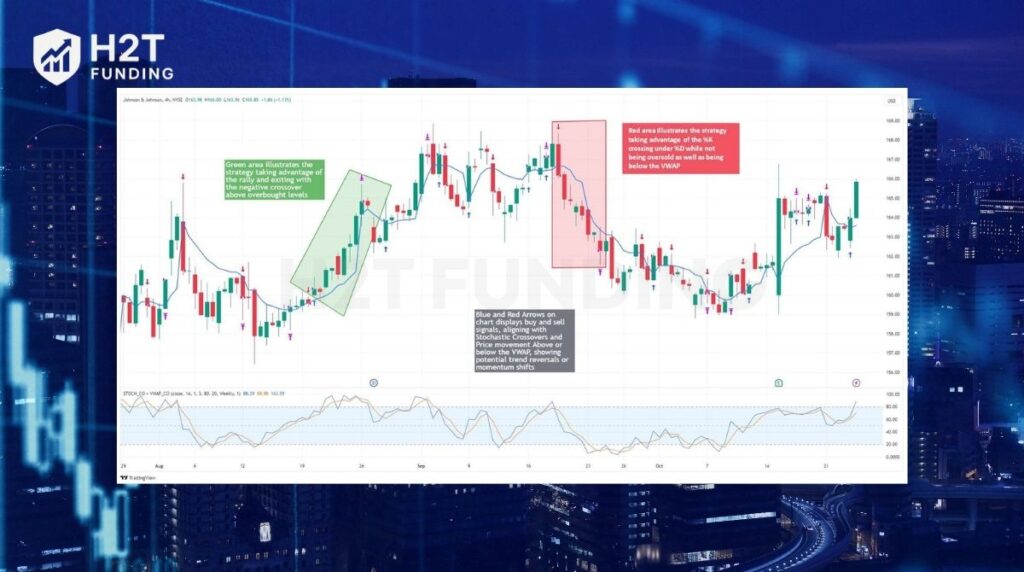
3.2. A practical strategy example
You can build a powerful system by combining different types of data.
- Step 1: Start with the VWAP to define the overarching daily direction. If the price is above the VWAP, traders often prioritize long setups, depending on the overall market conditions and their trading strategy.
- Step 2: Next, use a secondary tool to filter out bad entries. You can wait for a slight pullback on your momentum tool before joining the main trend.
- Step 3: Finally, execution is everything. Once your setup appears, use a reliable take profit trader platform to automate your exits. Setting a hard stop loss and a clear target immediately protects your capital.
In conclusion, a successful strategy is about harmony between a few carefully selected tools and strict execution. By eliminating redundant lines on your chart and relying on automated orders, you create a stress-free environment. This simple combination strategy is the true secret to surviving daily market noise and staying consistently profitable.
4. Real opinions from professional traders
When you ask full-time professionals about their screen setup, their answers might surprise you. A deep dive into active trading forums reveals a very consistent truth. Most veterans do not rely heavily on automated lines or complex math overlays.
Instead, they focus entirely on reading the raw chart and understanding supply and demand. They observe how buyers and sellers interact at key zones before making a move.
For these experts, technical tools are only used as a secondary check to verify their initial read of the market. They view these tools as lagging data rather than fortune tellers.
Here is what some experienced individuals had to say on a popular Reddit forum regarding this exact topic:
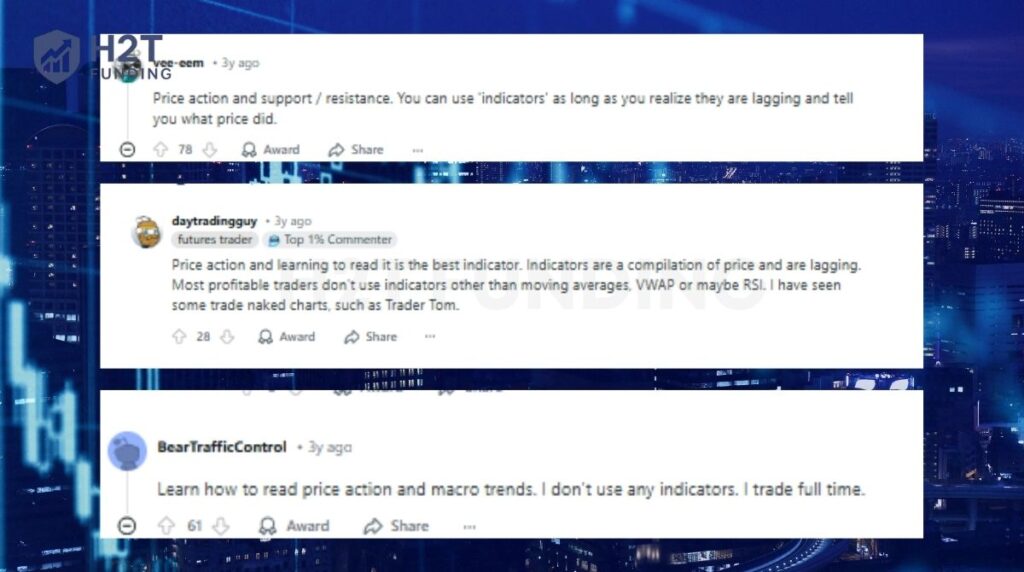
As you can see from these community insights, there is absolutely no magical tool that prints money. Relying blindly on lagging lines is a trap that catches many beginners. True consistency comes from screen time, deep focus, and strict personal discipline. Your ultimate edge is sticking to your tested plan without hesitation.
5. 3 common mistakes when using technical indicators
While these tools are helpful, they often lead new traders into common traps. These errors are not about the tools themselves, but rather how they are applied. Recognizing these pitfalls is the first step toward building a more robust and professional trading approach.
Here are the three most common mistakes you must avoid:
- Analysis Paralysis from a Crowded Chart: This is the most common trap for new traders. They add multiple momentum tools, several trend lines, and other overlays all at once. When these tools give conflicting signals, the trader freezes. They become too scared to act and miss perfect entry opportunities. A clean screen leads to clear decisions.
- Forgetting That Price Is King: Remember, every tool is just a mathematical formula based on past prices. Some people get so focused on a line crossing that they ignore the raw story the chart is telling. If the price breaks a key level with heavy volume, that is far more important than what any lagging overlay says. Always read the chart first.
- Lacking a Rules-Based System: A signal from a tool is not an automatic reason to enter a trade. Successful professionals have a strict set of rules for every entry they take. They wait for a specific setup that they have tested and trust. This removes all emotion from the process. Without a clear plan, you are just gambling on random signals.
Ultimately, avoiding these pitfalls comes down to discipline. Your success depends more on your mindset and your system than on the specific lines you use. A simple approach, combined with a deep respect for raw market data, is the key to consistent trading.
6. FAQs
There is no single “best” tool that works for everyone. However, many professional intraday traders consider the Volume-Weighted Average Price (VWAP) to be the most important. This is because it factors in the actual volume traded at each price level, giving a truer sense of the market.
No indicator can provide 100% accurate signals. However, a popular and highly-regarded combination on TradingView is using the VWAP to determine the main trend, and the RSI to time entries and exits. This duo provides a strong foundation for buy and sell decisions.
The “Big 3” indicators most commonly referred to are Moving Averages (MA), the Relative Strength Index (RSI), and the Moving Average Convergence Divergence (MACD). These are also three of the most popular and widely used tools available on the TradingView platform.
The Relative Strength Index (RSI) is widely used for identifying overbought and oversold conditions, but like all indicators, it should be combined with other tools. This is because the RSI can remain in overbought or oversold territories for extended periods during strong trends, making standalone reversal signals less reliable.
The Forex market is known for its high liquidity and periods of sideways movement. For this environment, Bollinger Bands are excellent for measuring volatility. The Stochastic Oscillator is also very useful for finding opportunities within these ranging markets.
Gold (XAU/USD) is heavily influenced by news events and respects key psychological levels. Therefore, Moving Averages (specifically the 20 and 50 period EMAs) and Fibonacci Retracement levels are extremely effective tools for trading it.
Options traders are highly focused on volatility and periods of price compression. Because of this, Bollinger Bands are a top choice. Combining them with a squeeze-type indicator can be a very powerful strategy for finding explosive breakout moves.
This is a simplified risk management guideline used by some traders, not a universal rule. It suggests risking no more than 3% of your capital on a single trade, keeping your total exposure across related trades under 5%, and aiming for a profit target of at least 7%.
Some traders experiment with time-based entry models, but there is no scientific evidence supporting the “3-6-9 rule” as a reliable strategy. Professionals always recommend relying on proven price action and risk management rather than pseudo-science theories.
While the “90%” figure is often a common internet myth, many studies suggest that a large percentage of retail traders do lose money. This is primarily due to poor risk management and emotional decision-making rather than their choice of indicators. Success comes from consistency and a disciplined trading plan, not a magic formula.
7. Conclusion
Finding the exact answer to what the best indicators are for day trading ultimately comes down to keeping your strategy simple. You do not need a screen full of messy lines to become a profitable trader. Instead, mastering a few core tools like the VWAP and RSI will give you a real edge in the market.
If you are ready to take your skills to the next level, explore the Prop Firm & Trading Strategies category at H2T Funding. We provide independent reviews, proven tactics, and the ultimate gateway to your funded trading success. Join our community today, apply your new chart knowledge, and start building wealth through funded accounts!