At the heart of measuring an investment’s true performance lies a critical comparison: the Sortino ratio vs Sharpe ratio. For years, the Sharpe ratio has been the go-to metric, but its core logic has a significant blind spot; it treats all volatility as risk. This means an explosive upward movement in your portfolio is penalized just as harshly as a steep decline, creating a distorted view of actual risk.
This is more than a technical detail; it’s a practical problem we’ve seen impact traders’ decisions right here at H2T Funding. That’s why the Sortino ratio is so crucial. It refines the calculation to focus only on what truly matters: harmful, downside volatility. By ignoring the good volatility of upward gains, it provides a much sharper, more realistic picture of an investment’s risk-adjusted return.
Key takeaways:
- The Sharpe ratio measures return against total risk (both good and bad volatility), while the Sortino ratio measures return against only harmful volatility (downside risk).
- Sharpe uses standard deviation to quantify total risk. Sortino uses downside deviation, focusing only on returns that fall below a specified target.
- Sharpe is best suited for well-diversified, low-volatility portfolios where return distributions are relatively symmetrical.
- The Sortino measure is more appropriate for high-volatility investments or when an investor’s primary concern is protecting against losses.
1. Understanding Sortino ratio vs Sharpe ratio
To properly compare these two metrics, it’s important to first establish a clear understanding of what each one measures. While both are fundamental tools for performance benchmarking, they approach the concept of “risk” from two distinct and critical angles.
1.1. What is the Sortino ratio?
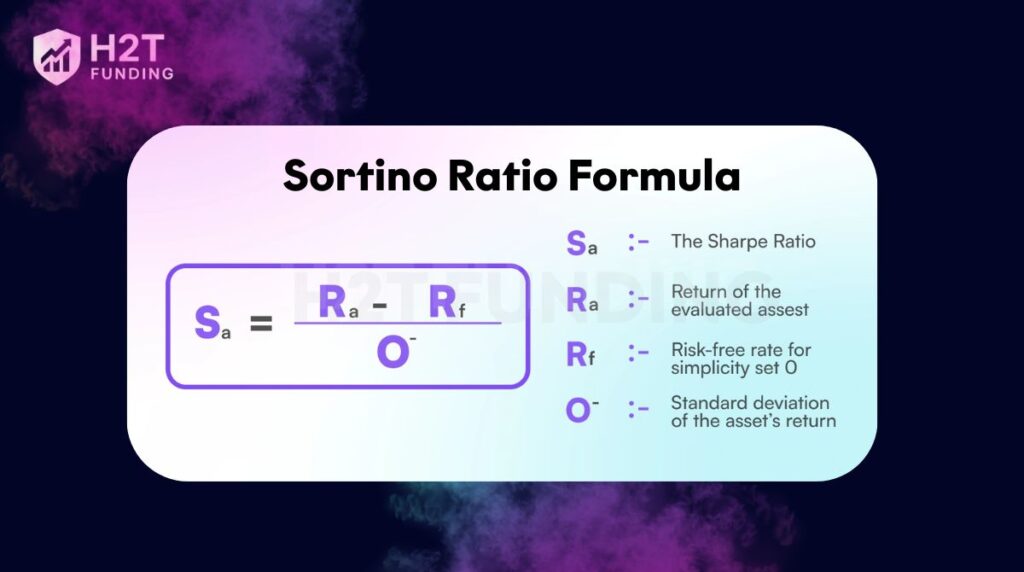
The Sortino ratio is a modification of the Sharpe ratio that measures the risk-adjusted return of an investment or portfolio. Developed by economist Frank A. Sortino, it distinguishes harmful volatility from overall volatility by using the standard deviation of only negative returns, a measure known as downside deviation.
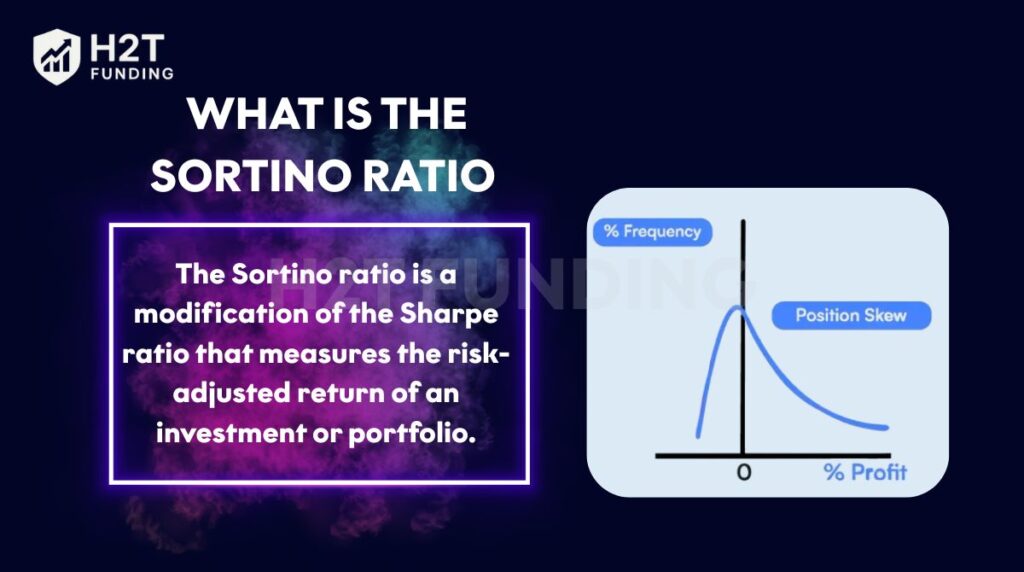
This focus on returns falling below a minimum acceptable return (MAR) provides a more realistic view of an investment’s downside risk. It helps investors better understand the potential for losses without being penalized for upside volatility.
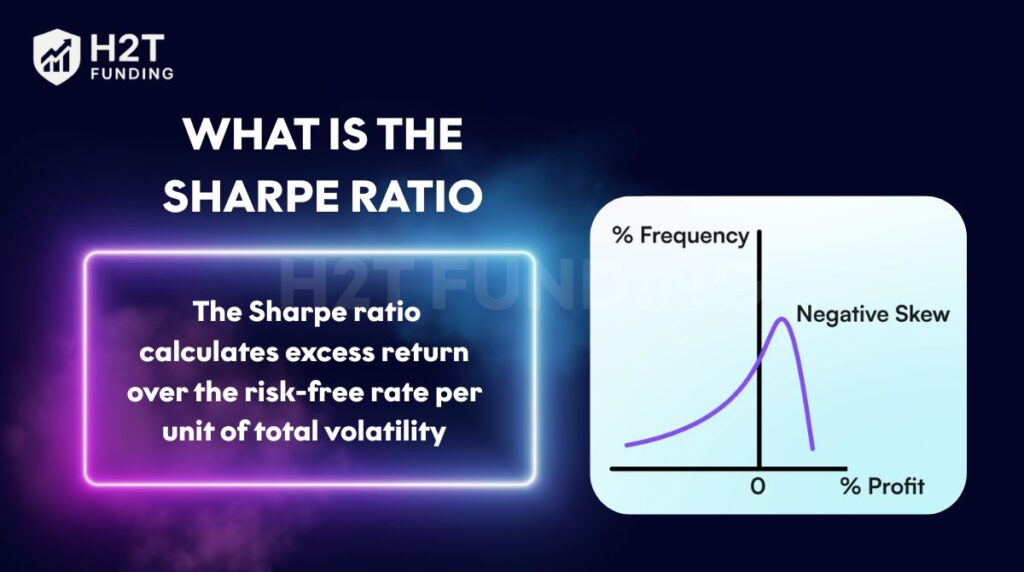
1.2. What is the Sharpe ratio?
Developed by William F. Sharpe, the Sharpe ratio calculates excess return over the risk-free rate per unit of total volatility. A higher value means better risk-adjusted performance. Similar to defining what is a trading plan, it offers a structured way to assess and compare investments.
2. Why compare Sharpe and Sortino ratios?
The need for this comparison stems directly from a fundamental limitation in the Sharpe ratio, which is often referenced in Prop Firm Rules as a standard for evaluating risk-adjusted return. While it provides a standardized measure of performance, its definition of “risk” is often too broad for practical application.
The main issue with the Sharpe ratio is that it penalizes an investment for all volatility, both positive and negative. It treats upside volatility (a sudden price increase) the same as downside risk (a sudden price drop), whereas most investors welcome positive volatility. The Sortino ratio was created to address this limitation.
By focusing exclusively on downside deviation, it provides a more accurate measure of the bad volatility that investors are genuinely concerned about, the risk of incurring losses. This distinction aligns with Prop Firm Rules emphasizing capital preservation and responsible risk management, making the Sortino ratio particularly valuable for investors whose primary goal is protecting their trading equity.
3. Compare Sharpe Ratio vs Sortino Ratio
To fully grasp the difference between Sharpe and Sortino ratios, a side-by-side comparison of the Sortino ratio vs Sharpe ratio formula is essential. The core distinction in the Sortino ratio vs the Sharpe ratio formula is the denominator: one uses total volatility (standard deviation), while the other uses only downside volatility (downside deviation).
| Feature | Sharpe Ratio | Sortino Ratio |
|---|---|---|
| Formula | (Rp – Rf) / σp | (Rp – Rf) / σd |
| Meaning of symbol | Rp: Expected portfolio return Rf: Risk-free rate σp: Standard deviation of the portfolio’s excess returns | Rp: Expected portfolio return Rf: Risk-free rate or Minimum Acceptable Return (MAR) σd: Downside deviation (risk of negative returns) |
| Risk measured | Total Volatility (Standard Deviation) | Downside Volatility (Downside Deviation) |
| Key advantage | Widely used, easy to calculate. | More accurately reflects an investor’s concern with losses. |
| Key limitation | Treats positive and negative volatility equally. | Less common, it requires more data points for an accurate calculation. |
3.1. Sharpe Ratio
The Sharpe ratio is a cornerstone of the capital asset pricing model and offers a straightforward way to analyze risk-adjusted returns.
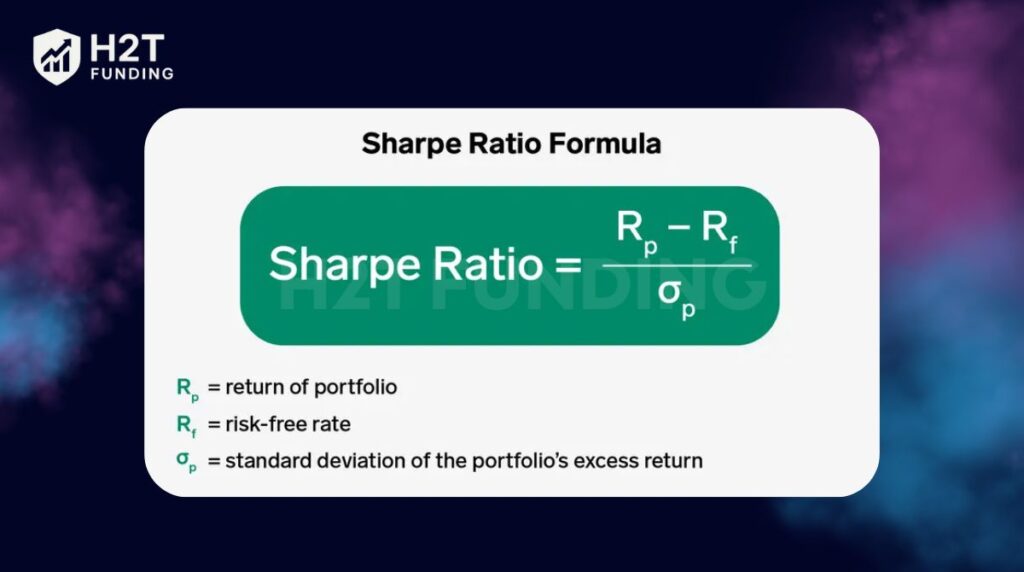
- Sharpe Ratio formula: Sharpe Ratio = (Rp – Rf) / σp
- Meaning: This ratio indicates the amount of excess return an investor receives for each unit of total risk. It helps to determine if higher returns are due to smart investment decisions or simply taking on more risk.
- Advantage: Its key strength lies in its universal adoption and simplicity, making it a reliable baseline for comparing the risk-adjusted returns of diverse assets like mutual funds or stocks.
- Limitation: Its primary drawback is its failure to distinguish between positive and negative volatility. Consequently, a portfolio generating strong, positive returns can be inaccurately penalized for what the formula broadly defines as “risk.”
3.2. Sortino Ratio
The Sortino ratio refines the Sharpe ratio by focusing only on the risk of loss.
- Sortino Ratio formula: Sortino Ratio = (Rp – Rf) / σd
- Meaning: This ratio measures the excess return for each unit of downside risk. It gives a clearer picture of how an investment performs during periods of market stress.
- Advantage: Its specific focus on harmful volatility provides a more precise risk assessment for investors whose primary concern is capital preservation and loss avoidance.
- Limitation: By design, the ratio completely disregards upside volatility. This can be a disadvantage when evaluating high-growth strategies where capturing extreme positive returns is a key objective.
Example:
Let’s consider the performance of these two ETFs over a 5-year period, from January 2019 to December 2023. This period includes a strong bull market, the COVID-19 crash, the powerful subsequent recovery, and the 2022 bear market.
Suppose we have the following annualized performance metrics (these figures are approximate for illustration):
| Metric | SPDR S&P 500 ETF (SPY) | Invesco QQQ Trust (QQQ) |
|---|---|---|
| Average Annual Return | 15.2% | 21.5% |
| Total Standard Deviation (Total Risk) | 18.5% | 24.0% |
| Downside Deviation (Downside Risk) | 12.0% | 15.5% |
We will use an average Risk-Free Rate for this period of 2.0%. For the Sortino ratio, we will also use a Minimum Acceptable Return (MAR) of 2.0% for a direct comparison.
1. Sharpe Ratio calculation
The Sharpe ratio measures the return generated per unit of total risk.
- Sharpe Ratio (SPY) = (15.2% – 2.0%) / 18.5% = 0.71
- Sharpe Ratio (QQQ) = (21.5% – 2.0%) / 24.0% = 0.81
Analysis based on the Sharpe Ratio: Based on the Sharpe ratio, QQQ appears to be the slightly better choice. Although it is much more volatile (its total risk is about 30% higher than SPY), its superior return is enough to compensate for that increased risk, resulting in higher total risk-adjusted performance.
2. Sortino Ratio calculation
The Sortino ratio focuses only on “bad” risk (downside volatility), ignoring positive volatility.
- Sortino Ratio (SPY) = (15.2% – 2.0%) / 12.0% = 1.10
- Sortino Ratio (QQQ) = (21.5% – 2.0%) / 15.5% = 1.26
Analysis based on the Sortino Ratio: When viewed through the lens of the Sortino ratio, QQQ’s outperformance becomes clearer. This ratio shows that QQQ was significantly more efficient at generating return per unit of downside risk.
Conclusion and Interpretation
This example tells a more nuanced story compared to the theoretical “Portfolio A/B” example:
- Why did QQQ perform better on both metrics? During this period, the strong growth of the technology sector generated very high returns for QQQ. Much of its higher total risk came from positive volatility (strong upward surges), which the Sharpe ratio treats as risk, but which investors desire.
- What story does the Sortino ratio tell? It confirms that even though QQQ had more severe drawdowns than SPY (15.5% downside deviation vs. 12.0%), the return generated was so large that it was still a more efficient choice, even when only considering the risk of loss.
- Investor Choice:
- An investor with a high risk tolerance who wants to maximize returns and isn’t too concerned with large swings (both up and down) would find QQQ attractive, and both ratios support this decision.
- A more conservative investor might still prefer SPY due to its lower overall volatility and smaller drawdowns, offering a smoother ride, despite its slightly lower risk-adjusted performance.
This real-world example emphasizes that there is no single right answer. Using both the Sharpe and Sortino ratios provides a deeper and more comprehensive view to help investors make decisions that align with their own risk appetite.
4. When to use Sharpe, when to use Sortino?
The choice between these financial metrics depends heavily on the investor’s risk tolerance and the nature of the investment strategies being evaluated.
4.1. When to use the Sharpe Ratio
The Sharpe ratio is most effective for analyzing well-diversified, lower-volatility portfolios such as balanced mutual funds or ETFs that track large-cap indices. In these cases, returns are usually more stable, so measuring total volatility provides a reliable view of risk-adjusted performance.
For example, a diversified equity-bond portfolio with annual returns of 8% and volatility of 5% versus a 2% risk-free rate would have a Sharpe ratio of 1.2. This gives a reliable measure of overall risk-adjusted performance when return distributions are fairly symmetrical.
4.2. When to use the Sortino Ratio
The Sortino ratio is better suited for higher-volatility assets such as growth stocks, hedge fund strategies, or crypto. It focuses only on downside risk, making it a more accurate tool for evaluating investments with skewed return distributions or frequent large price swings.
For instance, consider a crypto portfolio with an annual return of 15%, overall volatility of 20%, and downside deviation of 12% against a 2% MAR. Its Sharpe ratio would be only 0.65, but the Sortino ratio would be 1.08. This highlights how Sortino better captures the true performance by ignoring upside volatility that may unfairly penalize the Sharpe.
In practice, investors often use Sharpe to compare diversified portfolios and Sortino to evaluate concentrated or asymmetric-return assets, ensuring that risk is measured in a way that reflects their actual concerns.
5. Strategy for applying the Sharpe Ratio in investment results
To apply the Sharpe ratio effectively in your investment strategies, consider the following:
- Comparative analysis: Use the ratio primarily for performance benchmarking. Compare the Sharpe ratios of similar investments to see which offers better returns for the risk taken. This reflects the importance of applying the what is consistency rule in trading, where systematic evaluation matters more than isolated outcomes.
- Portfolio diversification: A 3 Sharpe ratio strategy might involve testing how adding a new asset changes the portfolio’s Sharpe ratio. A useful addition should lift the risk-adjusted return. Achieving this requires knowing how to be more disciplined in your trading and following a structured allocation plan.
- Context is key: Don’t look at the number in isolation. A “good” Sharpe ratio can be relative. For example, a ratio of 1.0 might be average in one sector but excellent in another.
6. Common mistakes when using Sharpe and Sortino
Even these powerful tools can be misleading if used incorrectly. Here are some common pitfalls:
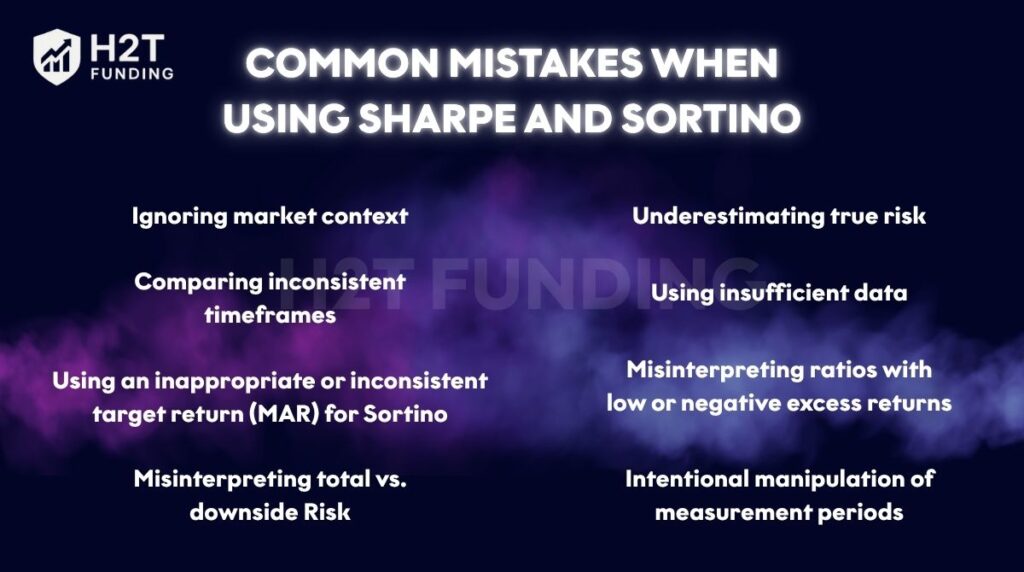
- Ignoring market context: A high ratio achieved during a strong bull market may not be as impressive as a moderate ratio earned during a flat or bear market. Always evaluate performance relative to the prevailing market conditions.
- Comparing inconsistent timeframes: This is a critical error. Comparing a ratio calculated on three months of daily data to one calculated on three years of monthly data is meaningless. Always ensure ratios are calculated over the same period and frequency, and use annualization for standardized comparison.
- Using an inappropriate or inconsistent target return (MAR) for Sortino: The choice of the Minimum Acceptable Return (MAR) is subjective but crucial. Using different MARs when comparing different funds makes the comparison invalid. Good benchmark choices for the MAR include:
- The risk-free rate: To measure outperformance over a “guaranteed” investment.
- The rate of inflation: To measure if the investment is generating a real return and preserving purchasing power.
- Zero: To evaluate performance based on absolute gains and losses.
- A market index return (e.g., S&P 500): To assess if the fund provides better downside-risk-adjusted returns than the broader market.
- Misinterpreting total vs. downside Risk (ignoring skewness): The Sharpe ratio uses total standard deviation, which penalizes a strategy for upside volatility just as it does for downside volatility. A strategy with occasional massive gains can have its Sharpe ratio unfairly lowered, while the Sortino ratio correctly ignores this “good” volatility.
- Underestimating true risk (ignoring negative skew and fat tails): The Sharpe ratio can mislead for strategies with rare but severe losses, understating the chance of a major drop. The Sortino ratio handles this better, but both struggle with extreme events in fat-tailed distributions.
- Using insufficient data: Ratios calculated from a short time series or a small sample size are not statistically significant and can be misleading. This is especially true for the Sortino ratio, which can be artificially inflated if the observation period contained very few negative returns to measure.
- Misinterpreting ratios with low or negative excess returns: When a portfolio’s average return is below the risk-free rate (or the MAR), the Sharpe and Sortino ratios become negative. In this situation, their interpretation becomes counterintuitive.
- Intentional manipulation of measurement periods: Managers can “game” the Sharpe ratio by cherry-picking dates or using longer intervals to mask volatility and inflate results. Similar caution applies to execution methods like trailing stop loss versus trailing stop limit, where selective testing can distort risk and performance metrics.
Read more:
7. FAQs
Generally, a Sharpe ratio above 1.0 is considered good, above 2.0 is very good, and above 3.0 is excellent. A ratio below 1.0 is often seen as sub-optimal. However, what constitutes a “good” ratio can depend on the asset class and market conditions.
For investors who are particularly concerned about downside risk, the Sortino ratio is often considered more reliable because it focuses on harmful volatility. It provides a better assessment of risk-adjusted returns for portfolios with non-symmetrical return patterns.
Yes, using both ratios provides a more comprehensive view of an investment’s performance. A high Sortino ratio combined with a relatively lower Sharpe ratio can indicate that the investment has significant positive fluctuations, which is desirable for many investors.
The key difference between all these ratios lies in how they define and measure risk: The Sharpe ratio uses total risk (standard deviation). The Sortino ratio uses downside risk (downside deviation). The Treynor ratio vs Sharpe ratio debate is relevant for diversified portfolios, as Treynor uses beta (systematic or market risk) instead of total risk. The information ratio vs the Sharpe ratio comparison is crucial for evaluating active fund managers, as the Information ratio measures a manager’s skill (alpha) relative to a benchmark’s volatility. Finally, the Calmar ratio vs the Sharpe ratio discussion centers on drawdown. The Calmar ratio uses the maximum drawdown as its risk metric, making it popular for evaluating hedge funds and trading strategies over longer periods.
The interpretation of the Sortino ratio follows a clear hierarchy where higher values consistently indicate superior performance. A value exceeding 1.0 is generally favorable, while readings above 2.0 are considered strong. A figure surpassing 3.0 is deemed exceptional, as it demonstrates an asset’s ability to generate strong returns without exposing investors to significant downside volatility.
A Sharpe ratio of 0.5 would be considered sub-optimal. It suggests that the investment’s excess returns are not adequately compensating for the total risk being taken.
The main disadvantage is that it completely ignores upside volatility. For strategies that aim for high growth, these positive fluctuations are a key part of the expected return profile. Additionally, it is less commonly reported and can be more complex to calculate.
To answer the common question of whether a sortino ratio high or low is desirable, the rule is simple: higher is always better. A high ratio indicates a superior risk-adjusted performance, specifically concerning downside risk. If comparing two mutual funds, the one with the higher Sortino ratio is providing more return for each unit of “bad” risk it takes on.
The Sharpe ratio measures returns against total volatility, while the Sortino ratio focuses only on downside risk. Sharpe is more common for general comparisons, but Sortino is often better for traders who want to evaluate performance with an emphasis on avoiding losses.
8. Conclusion
Ultimately, the debate of Sortino ratio vs Sharpe ratio is not about which is definitively better, but which is more appropriate for your specific needs. The Sharpe ratio offers a broad, established measure of risk-adjusted returns based on total volatility. The Sortino ratio provides a more nuanced view by focusing only on the downside risk that truly concerns most investors.
To see how these metrics are applied in the real world, check out our Prop Firm & Trading Strategies category of H2T Funding for in-depth guides and analysis. There you’ll find in-depth guides and analysis on advanced techniques used by professional traders.