In technical analysis, choosing the right moving average can dramatically impact your trading results. The two most widely used options are the Simple Moving Average vs Exponential Moving Average, both designed to smooth price data and highlight market trends.
While the Simple Moving Average (SMA) gives equal weight to all price points, the Exponential Moving Average (EMA) reacts faster to recent price changes, making it more sensitive to market movements. This difference often sparks the debate: which one should traders rely on in different market conditions?
In this article, we’ll break down the key differences between SMA and EMA, explain their pros and cons, and show practical ways to apply them in Forex and stock trading. By the end, you’ll know exactly when to use each moving average to maximize your trading edge.
Let’s explore which moving average fits your strategy best.
Key takeaways
- The core difference in Simple Moving Average vs Exponential Moving Average lies in sensitivity: SMA treats all data equally, while EMA gives more weight to recent prices.
- SMA is slower but more stable, making it reliable for long-term trend confirmation and support/resistance analysis.
- EMA responds faster, providing earlier signals, which suits short-term traders, but it can also generate false signals in sideways markets.
- Many strategies combine both, using SMA to confirm the overall trend and EMA for quicker entries and exits, maximizing their strengths.
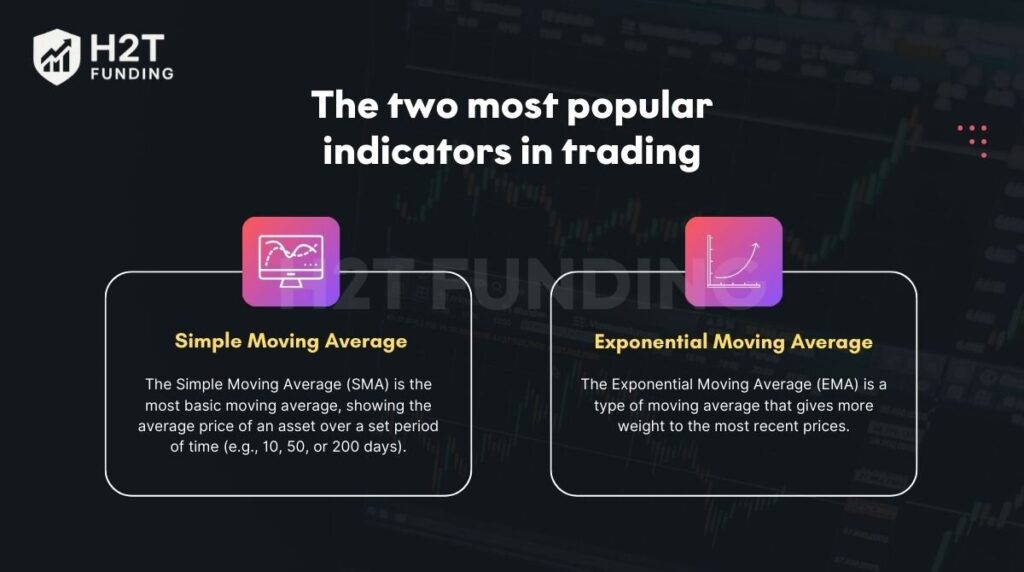
1. The two most popular indicators in trading
When learning technical analysis, most beginners quickly meet moving averages (MA). They are simple, visual, and powerful in filtering market noise. Among the many indicators, the moving average simple vs exponential stands out as the most popular because it helps traders identify trends and time their entries.
From my own trading journey, I found that without SMA and EMA, it’s much harder to spot momentum shifts. These two moving averages form the backbone of countless strategies, whether in stocks, forex, or crypto, and are often combined with tools like MACD or RSI for higher accuracy.
1.1. What is the simple moving average?
The Simple Moving Average (SMA) is the most basic moving average, showing the average price of an asset over a set period of time (e.g., 10, 50, or 200 days). It smooths out multiple price bars by treating all recent data points equally, which makes it easier to read the overall direction of the market.
Key characteristics of SMA:
- Creates a smooth line on the chart that filters out noise.
- Reacts more slowly to sudden price changes, which can help avoid false signals.
- Works well for identifying long-term trends but may lag in fast-moving markets.
Formula for SMA: SMA = (A1+A2+A3+…+An)/ n
Where:
- Aₙ = closing price at each period
- n = total number of periods used in the calculation
Example (15-day SMA): Imagine a stock that closes at the following prices:
- First 5 days: 21, 23, 25, 22, 24
- Next 5 days: 26, 27, 28, 26, 29
- Last 5 days: 30, 28, 29, 27, 28
If you add them all together, the total is 395. Divide this by 15 periods, and you get an SMA of 26.33. This number tells us the average closing price over 15 days, helping traders see the broader trend rather than reacting to each small price swing.
From my trading experience, SMA is particularly useful for spotting support and resistance levels on higher timeframes. The 200-day SMA in stock markets, for example, is closely watched by many institutional investors.
See more helpful articles:
1.1.1. Why do traders use MA in technical analysis?
Traders use moving averages because they simplify market data. Instead of reacting to every small fluctuation, the SMA smooths price action into a clearer line, making it easier to see the underlying direction. This helps reduce noise and keeps traders focused on the bigger picture.
For me, the SMA acts as a grounding force. I can’t tell you how many times I’ve been in a good trade where short-term volatility started to get in my head. Every tick against my position felt like a reason to bail out and take a small profit.
But glancing at the slow, steady slope of the SMA would remind me: “The underlying trend hasn’t changed.” It’s a simple visual cue that cuts through the noise and helps keep me anchored to my original analysis, preventing impulsive decisions.
1.1.2. The role of MA in determining trends and trading signals
Moving Averages play a central role in identifying market trends. When the price consistently stays above a long-term SMA, it signals an uptrend; when it remains below, it suggests a downtrend. This makes SMA an essential tool for spotting the broader direction of the market.
Another important application is trading signals through a Moving Average Crossover, which is one of the most widely recognized trend indicators in technical analysis.
A well-known example is the Golden Cross, where a short-term SMA (e.g., 50-day) crosses above a long-term SMA (e.g., 200-day), often viewed as a bullish signal. The opposite pattern, known as the Death Cross, indicates potential bearish momentum.
SMAs can also act as dynamic support and resistance, meaning the line itself becomes a level where price often bounces or stalls. A well-known case is the 200-day SMA in stock trading, closely followed by both institutions and retail traders.
In short, the SMA helps simplify price charts, confirm overall trends, and provide reliable signals. Its slower reaction to price changes makes it less suited for quick trades, but highly trusted for gauging the market’s broader direction.
1.2. What is the exponential moving average?
The Exponential Moving Average (EMA) is a type of moving average that gives more weight to the most recent prices. Unlike the SMA, which treats every data point equally, the EMA focuses more on what has happened recently, making it more responsive to current market conditions.
Instead of a plain average, EMA uses a weighting factor that decreases for older prices. This weighting is calculated as a percentage of influence given to each new data point, which makes the EMA react more strongly to the most recent data points on a chart.
Key characteristics of EMA:
- Reacts faster to new price changes compared to SMA.
- Provides earlier signals when trends are forming.
- More suitable for short-term trading styles like scalping or day trading.
- It can sometimes create false signals in sideways markets due to its sensitivity.
Example: Let’s say a stock has been trading around $100 for weeks but suddenly jumps to $110. The SMA will move slowly and may take several periods to reflect this change. The EMA, however, will rise quickly because it gives extra weight to the latest $110 price, helping traders catch the trend earlier.
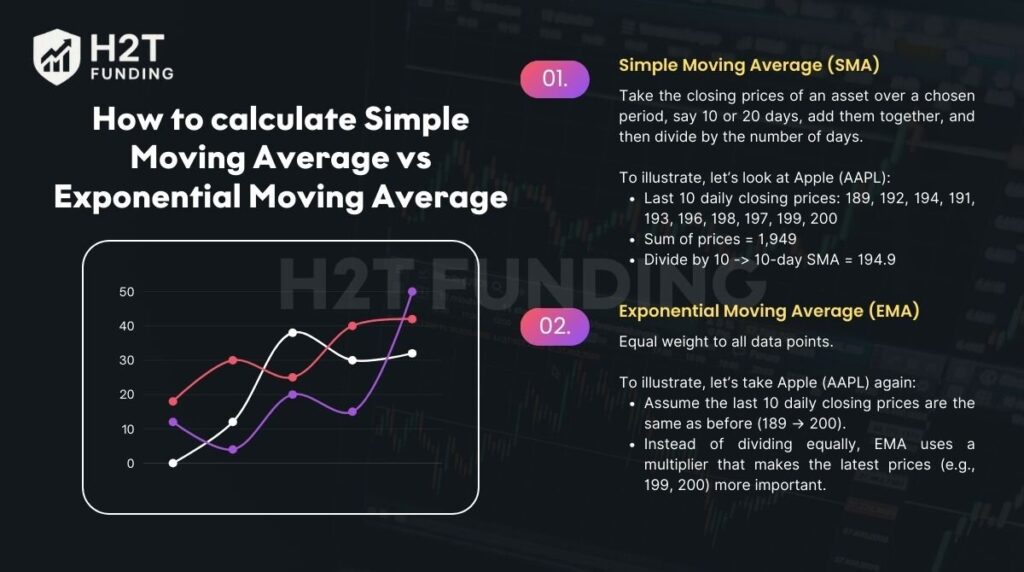
2. How to calculate Simple Moving Average vs Exponential Moving Average
With over three years of real trading experience, I’ve learned that understanding how indicators are calculated builds real confidence in using them. This knowledge also improves your charting skills, since you can interpret how each Moving Average line is drawn from raw market data.
In this section, I’ll guide you step by step EMA vs SMA calculation so you can apply them with clarity in your own trading.
2.1. Simple Moving Average (SMA)
To start, let’s look at the Simple Moving Average, the most straightforward form of a moving average. Its calculation is easy: you take the closing prices of an asset over a chosen period, say 10 or 20 days, add them together, and then divide by the number of days.
To illustrate, let’s look at Apple (AAPL):
- Last 10 daily closing prices: 189, 192, 194, 191, 193, 196, 198, 197, 199, 200
- Sum of prices = 1,949
- Divide by 10 -> 10-day SMA = 194.9
This value tells us the average price level of Apple’s stock over the last 10 days, providing a clearer picture of direction without being distracted by each small movement.
SMA is most effective for confirming long-term trends or identifying key support and resistance zones. Still, traders often combine it with EMA or other tools to avoid missing early signals in volatile markets.
2.2. Exponential Moving Average (EMA)
The Exponential Moving Average (EMA) is designed to respond faster to recent price changes. Unlike the SMA, which gives equal weight to all data points, EMA assigns greater weight to the most recent prices, making it more suitable for traders who need quicker signals.
To illustrate, let’s take Apple (AAPL) again:
- Assume the last 10 daily closing prices are the same as before (189 → 200).
- Instead of dividing equally, EMA uses a multiplier that makes the latest prices (e.g., 199, 200) more important.
This weighting causes the EMA value to rise faster than the SMA, showing Apple’s upward momentum earlier.
In short, the EMA is a faster, more responsive tool that suits short-term traders, but its sensitivity means it must be used carefully in ranging markets.
Continue reading: How to calculate lot size in Forex for smart risk management
3. Pros and cons of Simple Moving Average vs Exponential
One of the first questions new traders ask is, “Should I use the SMA or the EMA?” There’s no magic bullet here. Think of them as two different tools for two different jobs. The SMA is your sturdy, reliable wrench, while the EMA is more like a high-speed power tool.
The best choice depends entirely on what you’re trying to accomplish. Lying them side by side makes the differences much clearer.
| Aspect | Simple Moving Average (SMA) | Exponential Moving Average (EMA) |
|---|---|---|
| Pros | Easy to calculate and apply Smooths out price action, reducing noise Reliable for identifying long-term support/resistance | Reacts quickly to new price changes Captures trend reversals earlier Useful in fast-moving or volatile markets |
| Cons | Reacts slowly to new information May lag in strong trends, causing late entries/exits | Can create false signals in sideways markets Slightly more complex to calculate and interpret |
SMA is prized for its simplicity and stability, making it a reliable tool for long-term investors. EMA, meanwhile, is preferred by short-term traders for its quick response, helping them spot precise entry points in volatile markets. Ultimately, the better choice isn’t about SMA vs EMA, but about which one aligns with your trading strategy.
Read more: How to be more disciplined in your trading?
4. Difference between Simple Moving Average and Exponential Moving Average
Although both SMA and EMA are used to smooth price data, they behave very differently in practice. By comparing them across multiple factors, traders can better decide which one aligns with their goals and trading horizon.
| Criteria | Simple Moving Average (SMA) | Exponential Moving Average (EMA) |
|---|---|---|
| 1. Calculation Method | Equal weight for all prices | Higher weight on recent prices |
| 2. Weighting of Data Points | No weighting applied | Uses a multiplier to prioritize the latest data |
| 3. Sensitivity to Price Changes | Less sensitive, reacts slowly | Highly sensitive, reacts quickly |
| 4. Lag Time | Greater lag, especially in volatile markets | Smaller lag, adjusts faster |
| 5. Reaction to Price Reversals | Delayed response | Faster detection of reversals |
| 6. Use Cases in Trading Strategies | Better for long-term trend confirmation | Better for short-term trading and fast markets |
| 7. Trend Identification | Provides smooth and stable trend lines | Highlights emerging trends earlier |
| 8. Calculation Complexity | Very simple, easy to understand | Slightly more complex but automated on platforms |
| 9. Adaptability to Market Conditions | Works well in stable markets | More effective in volatile conditions |
| 10. Common Applications | Popular for 50-day and 200-day analysis | Often used in MACD, RSI, and crossover strategies |
The SMA is slow but steady, giving traders confidence in long-term signals, while the EMA is faster and better suited for traders who want early entries. Both are useful, but their effectiveness depends on the market environment and trading style.
Find out more here: How to backtest a trading strategy: The ultimate A-Z guide
5. When to use SMA and when to use EMA?
The real value of moving averages comes from knowing which one to use under specific conditions. SMA and EMA are not competing tools; they serve different purposes depending on whether the trader prioritizes stability or speed of reaction.
1. Using SMA
The SMA is most effective when the goal is to identify the big picture trend and avoid overreacting to daily volatility. It’s trusted by long-term investors and is often used to confirm market direction.
- Long-term trend analysis: The 200-day SMA is widely used to define whether a market is in a bullish or bearish phase.
- Support and resistance levels: Its smooth curve provides natural areas where prices tend to bounce or reverse.
- Stable or low-volatility markets: SMA filters out noise and gives reliable confirmation signals.
2. Using EMA
EMA becomes more valuable in dynamic and fast-moving markets, where traders need signals that respond quickly to price shifts. It helps capture momentum early, which is crucial for short-term trading.
- Intraday and short-term trading: Favored by scalpers and day traders for its speed.
- Markets with strong momentum: EMA highlights reversals and continuations faster than SMA.
- Entry and exit refinement: Shorter EMAs (10 or 20 periods) provide more precise timing signals.
3. Combining SMA and EMA
The most practical approach is to use SMA and EMA together. The SMA confirms the broader market structure, while the EMA provides sharper entry and exit points.
- Confirm trend direction: A long-term SMA (e.g., 200-day) acts as the backbone of the analysis.
- Capture earlier signals: A short EMA (e.g., 20-day) reacts quicker, allowing timely adjustments.
- Crossover setup: When a short EMA crosses above a long SMA, it often signals bullish momentum; the opposite indicates bearish conditions.
SMA offers stability and is best for confirming long-term trends, while EMA provides speed and precision for short-term trading. Neither works best in isolation; their power comes from using them together in the right context.
In my trading, I rarely depend on just one moving average. I often use the SMA to define the bigger picture and the EMA to fine-tune my entries. This balance helps me see both the overall trend and the precise timing for action.
For example, in 2020, with Microsoft (MSFT), the stock stayed above its 200-day SMA, signaling a bullish long-term trend. When the 20-day EMA curled back up near $190, it confirmed my entry point. Even with pullbacks, the SMA gave me conviction to hold, showing how the two work best together.
6. Practical applications and illustrative examples
Analyzing charts with actual data helps bring SMA and EMA to life. Let’s look at real examples to show how they perform in the market, and how EMA often leads to earlier signals.
Example 1: Comparing SMA and EMA on the same stock
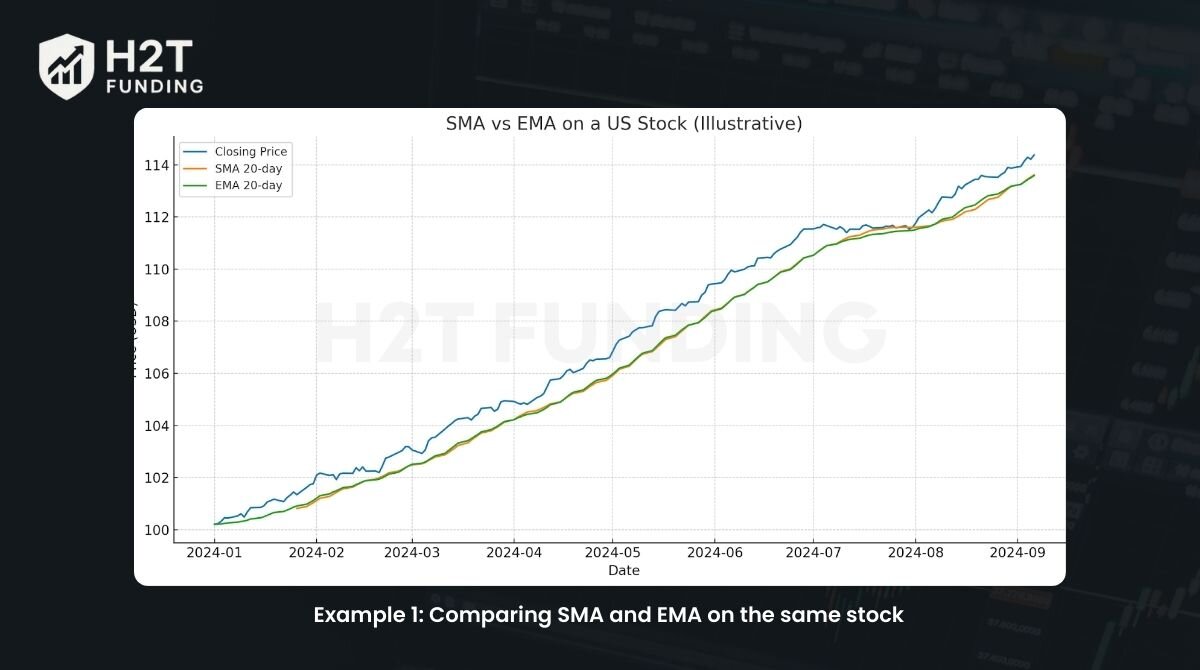
The chart above shows how a 20-day Simple Moving Average (SMA) and a 20-day Exponential Moving Average (EMA) behave when applied to the same stock in the US market. By plotting them against daily price bars, traders can visually compare how each line smooths data differently.
- SMA (orange line) smooths out price fluctuations by giving equal weight to all past data points in the window. This makes it slower to react, but also less sensitive to short-term noise.
- EMA (green line) gives more weight to recent prices, which makes it respond faster to sudden market moves. As a result, it stays closer to the actual price (blue line) and can generate earlier trading signals.
Example 2: When EMA gives an earlier signal than SMA
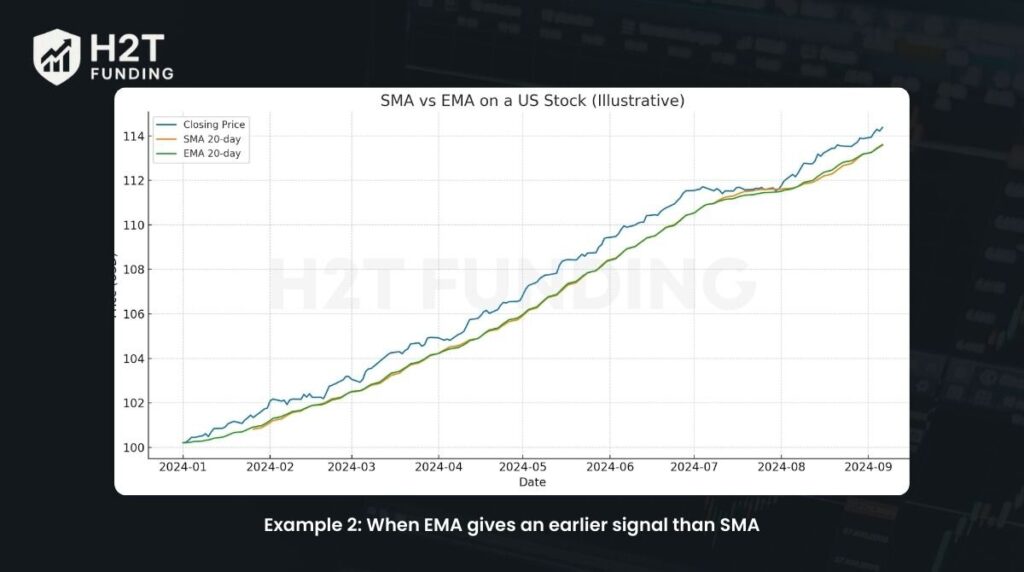
The chart demonstrates a typical scenario where Exponential Moving Averages (EMA) provide trading signals faster than Simple Moving Averages (SMA).
- Here, the EMA(9) crossing above the EMA(21) (orange over green) occurs noticeably earlier than the SMA(10) crossing above the SMA(20) (red over purple).
- This earlier crossover can alert traders to a potential uptrend sooner, allowing them to enter trades earlier than if they relied solely on the SMA.
- However, the same sensitivity that makes EMA faster also makes it more prone to false signals during periods of sideways or choppy markets.
Example 3: Combining SMA/EMA with MACD and RSI
Traders rarely rely on moving averages alone. Instead, they often combine SMA and EMA with momentum indicators like MACD and RSI to improve accuracy and reduce false signals.
MACD is built from EMAs
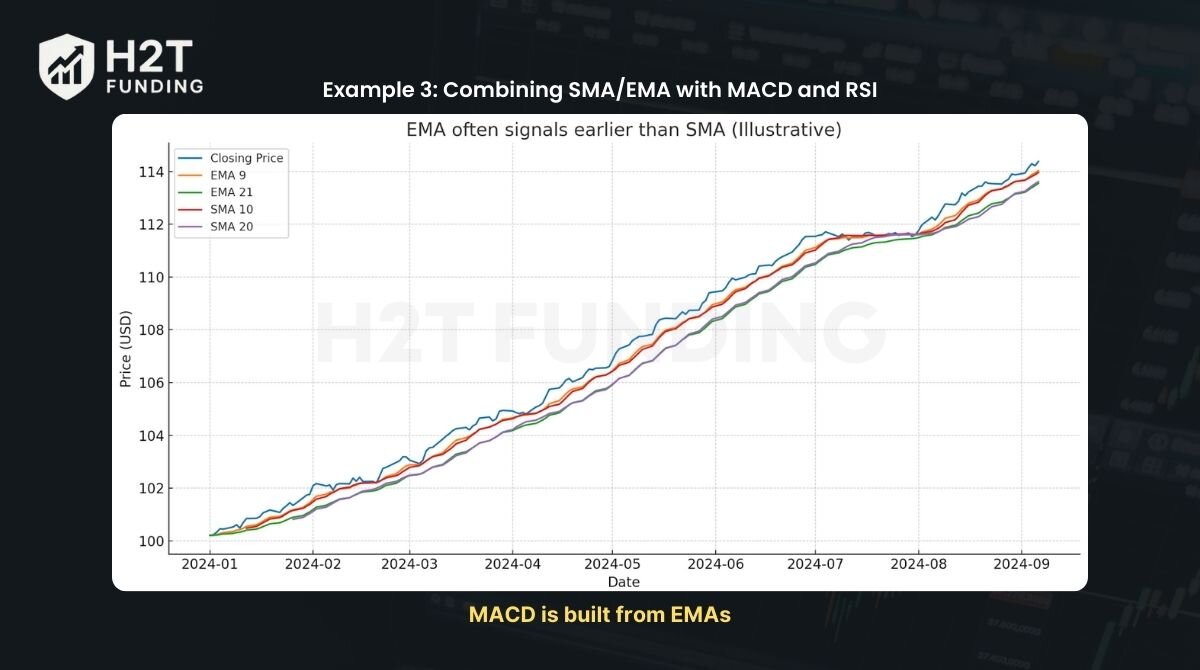
The first chart shows the Moving Average Convergence Divergence (MACD), which is derived from EMAs:
- MACD line (blue) = EMA(12) – EMA(26).
- Signal line (orange) = 9-period EMA of the MACD line.
- Histogram (bars) = difference between MACD and Signal line.
When the MACD line crosses above the Signal line, it indicates bullish momentum; when it crosses below, it signals bearish pressure.
RSI as a confirmation filter
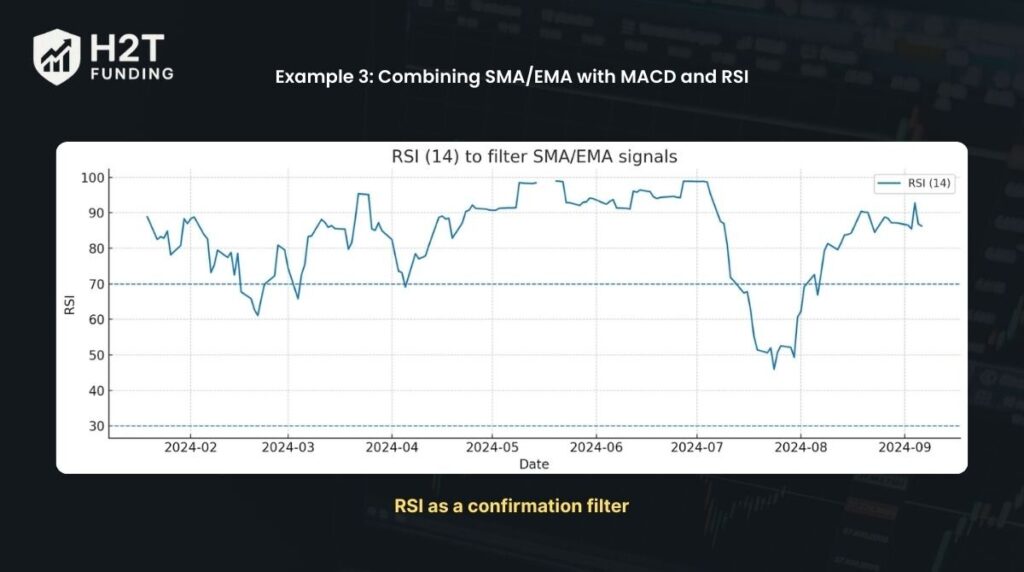
The second chart illustrates the Relative Strength Index (RSI):
- RSI(14) above 70 -> overbought zone.
- RSI(14) below 30 -> oversold zone.
By combining RSI with moving averages:
- If EMA gives a bullish crossover while RSI is below 30 (oversold), it increases the confidence in a long entry.
- Conversely, if EMA signals bullish but RSI is already above 70, traders might avoid entering due to the high risk of reversal.
These three examples show how SMA and EMA behave differently in practice: SMA offers smoother, more reliable trend confirmation, while EMA delivers faster but sometimes noisier signals.
Combining them with momentum indicators such as MACD and RSI, traders can balance trend clarity, timing, and signal reliability. This integration helps reduce false entries and provides a more complete view of market conditions.
Check it out: Mastering grid trading: Strategies to maximize profits
7. FAQs
SMA is often better for beginners because it is simpler and less sensitive to short-term noise, making trends easier to recognize. EMA reacts faster but can produce false signals in volatile markets. Beginners may find SMA more reliable for learning trend basics.
Yes. Many traders use EMA for early entry and SMA for trend confirmation. For example, if EMA signals a breakout but SMA supports the broader trend, it increases confidence in the trade.
The timeframe depends on your trading style. Day traders often use short-term MAs (e.g., 9–21 EMA), swing traders prefer medium-term (20–50), and long-term investors rely on 100–200 SMA to track overall market direction.
By default, when people mention the “200-day moving average,” they usually mean the 200-day SMA. However, some traders also apply a 200-day EMA for quicker reaction, depending on their strategy.
EMA is best in fast-moving markets or shorter timeframes, where early signals are crucial. It helps traders catch trends sooner, but should be paired with filters like RSI or MACD to avoid whipsaws.
A common method is to use EMA for entry timing and SMA for trend validation. Traders often look for a moving average crossover between the two, as it can act as a high-probability signal for entering or exiting trades. For instance, if EMA crosses bullishly but SMA shows the market is still trending up, it strengthens the buy decision.
This strategy uses three EMAs (5, 8, and 13). When the shorter EMAs (5 and 8) cross above the 13 EMA, it signals bullish momentum; when they cross below, it indicates bearish momentum. It’s popular in intraday trading.
RSI itself doesn’t use SMA or EMA; it’s calculated from average gains and losses over a set period (commonly 14). However, some platforms smooth RSI values using EMA to make the indicator less choppy.
8. Conclude
Both moving average exponential vs simple are essential tools for traders, but they serve different purposes. SMA is valued for its stability and ability to smooth long-term price movements, while EMA reacts faster to recent changes and delivers earlier signals.
There is no single “best” moving average. Choosing between SMA and EMA depends on your trading objectives, the timeframe you focus on, and how much short-term volatility you are comfortable with. Your strategy should guide which tool you rely on more.
The best way to decide is by experimenting with both indicators on a demo account. Observing how SMA and EMA perform in different market conditions will help you determine which aligns best with your trading style and risk tolerance.
Ultimately, understanding the difference between Simple Moving Average vs Exponential Moving Average will help you make more accurate decisions and build strategies that fit your investment goals.
For deeper insights, explore the Prop Firm and Trading Strategies section at H2T Funding to see these concepts applied in practice.