The best MACD settings for 5-minute chart configurations involve reducing default periods to (5, 13, 1) or (8, 17, 9) to capture rapid intraday shifts. At H2T Funding, we utilize these optimized parameters to help traders identify momentum bursts and early reversals with higher precision.
Key Takeaways
- Default inputs like (12, 26, 9) often lag too much for quick 5-minute price shifts.
- Fast settings enhance responsiveness, allowing for earlier entries during high volatility.
- Balanced parameters provide a stable middle ground between signal speed and noise reduction.
- Trend alignment using higher timeframe filters significantly reduces the impact of whipsaws.
- Confirmation tools such as volume or support levels are vital for validating crossovers.
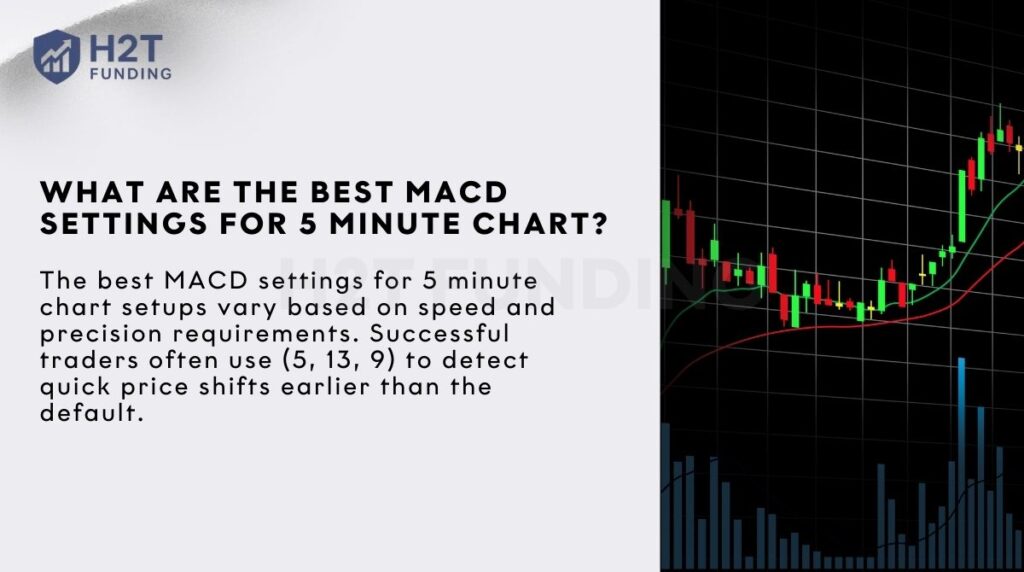
1. What are the best MACD settings for 5 minute chart?
The best MACD settings for 5 minute chart setups vary based on speed and precision requirements. Successful traders often use (5, 13, 9) to detect quick price shifts earlier than the default. Choosing the right setup involves balancing reaction speed with signal precision. Picking a specific configuration depends on the current volatility levels within the market.
The standard (12, 26, 9) MACD remains a golden standard because it offers reliable trend data. Using these default settings provides a smoother EMA output that effectively filters out market noise. The default configuration provides a stable baseline for newer traders. Beginners often favor this stability to avoid reacting to every minor price shift.
Professionals often choose the (8, 17, 9) balanced setup to reduce significant indicator lag. It provides a timely crossover without generating excessive false signals during the trading session. Balanced settings reduce lag while maintaining a high win rate. This medium sensitivity helps capture meaningful moves while ensuring signal clarity remains high.
Traders wanting to capture momentum bursts early should utilize (5, 13, 9) fast settings. This setup shortens the slow settings to identify sharp changes during active hours on a 5-minute chart. Reactive inputs are ideal for capturing sudden price reversals. This approach helps traders enter positions before the majority of the move occurs.
2. Understanding MACD indicator components for short-term trading
The MACD indicator settings for 5 minute chart rely on three core components to track momentum efficiently. These parts provide essential data for any short-term trading strategy. Effective analysis requires understanding how these elements interact during live sessions. By monitoring these indicators, traders can navigate changing market conditions with higher confidence.
| Component | Function | Technical Detail |
|---|---|---|
| MACD Line | Tracks current trend direction | Difference between 12 and 26 EMA |
| Signal Line | Generates triggers for entries | 9-period average of the main line |
| Histogram | Visualizes momentum strength | Difference between line and signal |
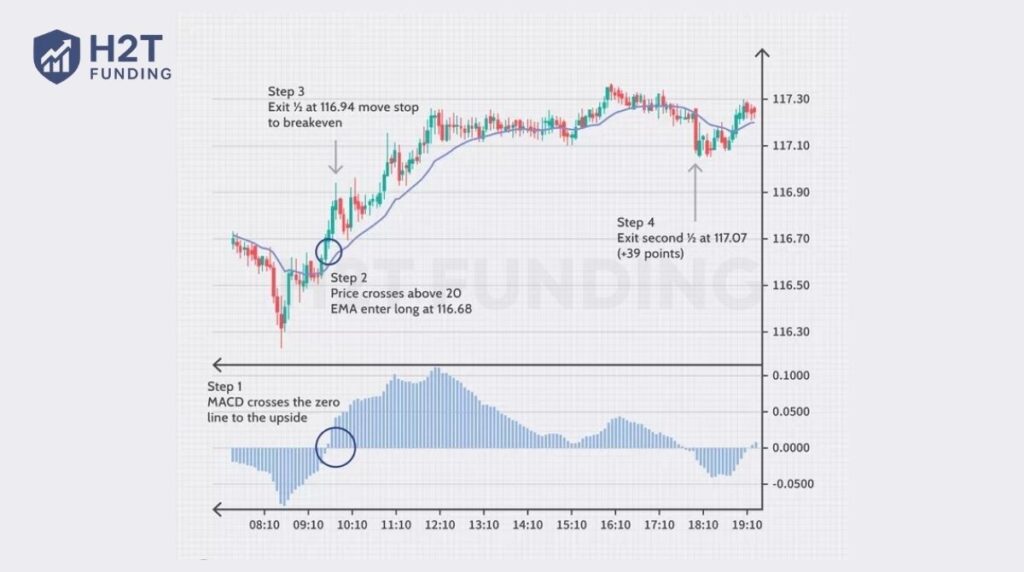
The main line shows the gap between two moving averages to capture the price movement accurately. It serves as the heartbeat of price action during fast-paced intraday intervals. Tracking this line helps identify the immediate direction of market strength. It is a fundamental part of modern technical analysis for professional traders.
The signal line acts as a specific trigger mechanism to generate a timely entry signal. When the main line crosses this average, it suggests a potential shift in market bias. Wait for a clear crossover to confirm high-probability opportunities. A sharp cross often indicates that volatility is fueling a new directional move.
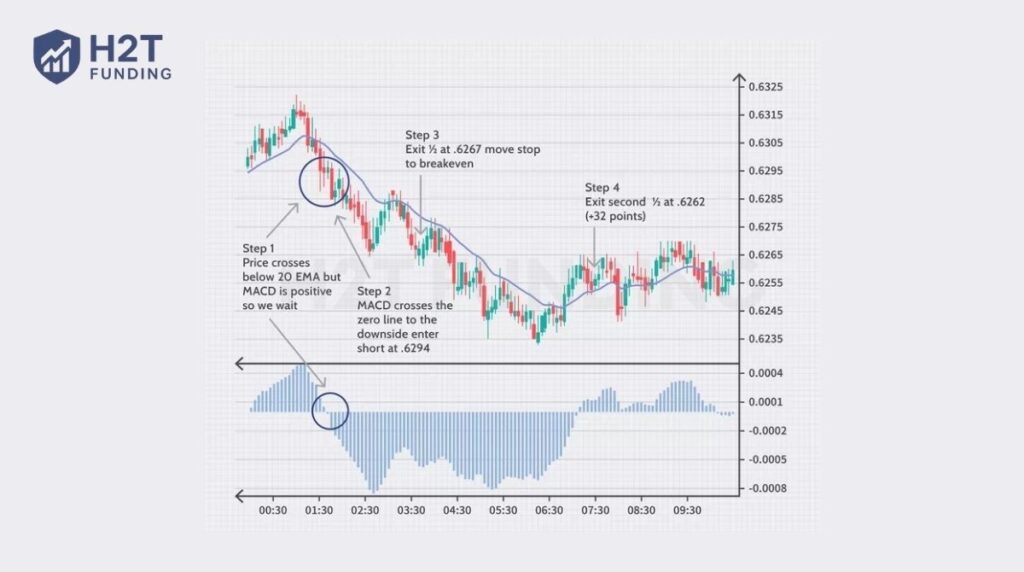
The histogram visualizes the distance between the MACD Line and the Signal Line, calculated with the formula: MACD Line – Signal Line. Green bars represent bullish strength, while red bars indicate growing bearish pressure. When the bars get longer, it suggests momentum is accelerating; when they shorten, it warns of potential exhaustion or a reversal. This visual tool simplifies reading a MACD setting for 5 min chart.
3. Optimized MACD setup for day trading: Getting technical
Adjusting your best MACD settings for 5 minute chart parameters allows you to align with specific intraday dynamics. Traders modify exponential moving average lengths to increase responsiveness to current price volatility. Choosing an optimized configuration depends heavily on your preferred trading style and objectives.
| Trading Style | Fast EMA | Slow EMA | Signal Line | Pros / Cons |
|---|---|---|---|---|
| Standard Trend | 12 | 26 | 9 | Pros: Reliable, few false signals. Cons: Can lag in fast markets. |
| Balanced Momentum | 8 | 17 | 9 | Pros: Good balance of speed and clarity. Cons: Can still miss ultra-fast moves. |
| Fast Scalping | 5 | 13 | 9 | Pros: Very responsive, early entries. Cons: More prone to noise and whipsaws. |
3.1. The Speed Demon (5-35-5)
Certain studies, such as one by Kang (2021), have shown that custom settings like (5, 35, 5) can yield high performance. This setup pairs a fast EMA (5) with a very slow EMA (35) to filter out trend noise, while a short Signal Line (5) maintains signal responsiveness.
Note: This is an advanced configuration and can be counter-intuitive; traders should test it thoroughly on a demo account before live application.
3.2. The Precision Play (3-10-16)
The (3, 10, 16) configuration is an example of a highly personalized setup, designed for early entries with smoother exits. By using a longer Signal Line (16), it filters out minor price jitter and helps traders stay in trending moves. It should be noted that this is not a common standard and is better suited for experienced traders.
3.3. MACD Settings for Scalping (3, 10, 1)
The best MACD settings for 5 minutes chart like (3, 10, 1), provide almost instant feedback on price shifts. Shortened signal lines trigger crossovers immediately after a momentum shift begins. This aggressive approach is essential for scalping strategies where capturing small pips with high frequency is the main goal.
4. Best MACD settings for 5-minute chart crypto and high-volatility assets
The best MACD settings for 5 minute chart crypto sessions usually require tighter inputs like (3, 10, 1) or (5, 13, 9) to navigate perpetual volatility. Cryptocurrency markets operate 24/7 and experience rapid price shifts that standard parameters often miss. Traders must increase indicator sensitivity to identify short-term reversals in assets like BTC or ETH.
Adjusting for speculative assets like meme coins necessitates ultra-responsive MACD inputs compared to large-cap giants. High–volatility coins demand faster EMA settings to provide an early exit strategy. This ensures you capture sudden momentum spikes before the liquidity fades or the trend reverses completely.
Managing whipsaws in the NASDAQ or major tech stocks requires a balance between speed and smoothing. Aggressive settings often trigger premature crossover signals during choppy market conditions. Using a slightly slower signal line helps filter out these fake moves while tracking the broader price movement of high-beta tech equities.
| Asset Type | Recommended Input | Use Case |
|---|---|---|
| Large-Cap Crypto | 5, 13, 9 | Balanced trend confirmation |
| Meme Coins/Alts | 2, 8, 5 | Ultra-fast momentum detection |
| Tech Stocks/NASDAQ | 8, 17, 9 | Noise filtering during gaps |
Risk Warning: Ultra-sensitive settings like (2, 8, 5) for Altcoins can generate a high number of false signals. They should only be used by experienced traders and must be strongly confirmed with other tools like volume, VWAP, or trend filters from higher timeframes to avoid whipsaws.
Use these indicators to spot a potential crossover at major support levels for high-probability entries. Aligning the EMA values with the current asset class improves the accuracy of every trade. This systematic approach ensures your technical analysis stays relevant regardless of how fast the momentum changes.
Spotting a bullish or bearish shift as it forms allows for more precise entries into trending moves. Waiting for the histogram to expand confirms that the move has significant institutional backing. This step prevents entering trades based on random volatility rather than a sustainable shift in market direction.
5. What to pair your 5-min MACD settings with for higher success?
Integrating secondary verification tools filters out low-probability trades efficiently. Success increases when momentum and market structure align at the same moment. Using multiple verification layers helps confirm real directional shifts.
5.1. The momentum trio: MACD + RSI + VWAP
Combine RSI and VWAP to identify high-probability entries with minimal lag. The Relative Strength Index identifies overbought or oversold extremes. Confirm that the Volume Weighted Average Price supports the current directional bias. Institutional pressure must align with the signal for a valid move. This alignment ensures that volume backs the price shift.
5.2. Trend filtering: Using the 200 EMA to align with “big money” flow
Utilize a 200-period average as a macro directional filter for your entries. Focus only on long entries when candles hold above this level. Staying on the right side of the overall flow reduces significant losses. This approach ensures you trade alongside dominant market participants. It helps avoid being caught in strong counter-trend corrections.
5.3. Structural confluence: Aligning MACD crossovers with support and resistance zones
Wait for a structural breakout at horizontal price points to validate your signals. Confluence with support/resistance zones provides a logical reason for a move. Ensure the indicator triggers a cross exactly at these critical areas. Executing near key levels improves the potential reward-to-risk ratio. It filters out random noise occurring in the middle of ranges.
Building a robust system requires more than just indicator settings. Combining momentum with trend and structure creates a powerful confluence. Patience ensures you wait for these specific signals to align perfectly. This disciplined approach consistently yields higher-quality trade outcomes during intraday sessions.
6. Best MACD settings for 5-minute chart, Reddit, Facebook, and other communities
Trading communities provide unique insights based on real-world market testing. Peer discussions reveal how successful individuals adapt these tools for intraday volatility. These platforms highlight both the strengths and frustrations experienced during live sessions.
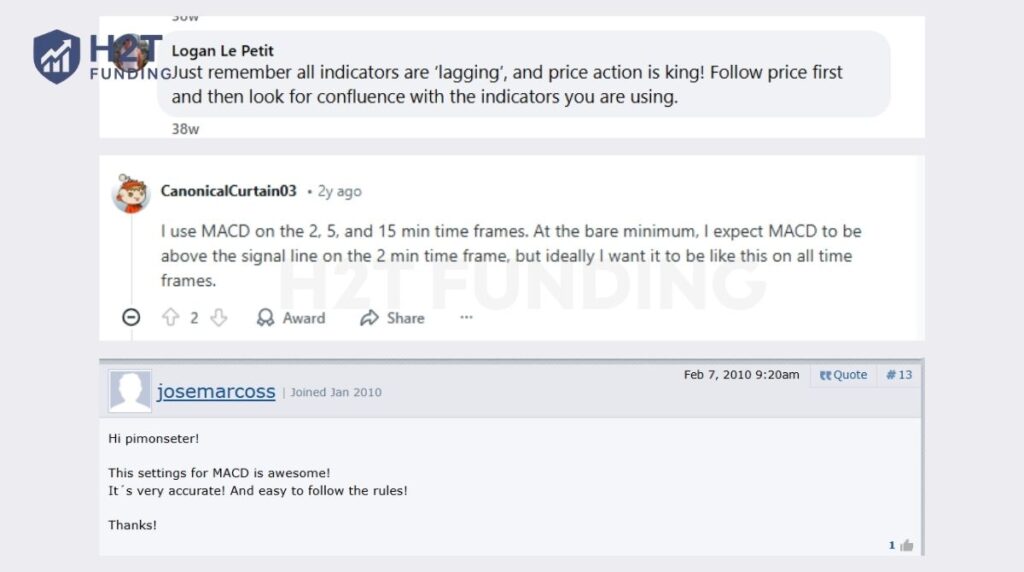
A major debate centers on the inherent delay of mathematical formulas. Critics argue that following price action remains more reliable than lagging indicators. Many veterans use the 5-minute signal only as a final entry trigger.
Community data suggests that multi-timeframe alignment is the most effective approach. Filtering signals through higher charts reduces the frequency of avoidable mistakes. Consistent profitability relies on confluence rather than a single perfect setting.
7. Common pitfalls and mistakes to avoid in 5-minute trading
Establishing a logical MACD setting for 5 min chart involves avoiding emotional impulses. Avoiding common errors helps preserve capital during volatile sessions. Traps often appear as perfect setups but lack structural weight.
- Trading without spotting a clear divergence often triggers entries into exhausting moves.
- Regular divergence identifies when a current trend loses significant power.
- Ignoring higher timeframes causes traders to fight against dominant money flow.
- Searching for “Holy Grail” settings prevents the development of professional intuition.
- Failing to use risk management rules leads to rapid account depletion.
Consistency with one setup builds the experience needed for success. Focusing on high-quality setups over quantity improves your bottom line. Professional traders value discipline more than finding a perfect indicator.
8. How to use MACD to pass prop firm challenges
Passing a prop firm challenge requires a strict synergy between MACD signals and capital preservation tactics. Successful prop firm trading focuses on longevity through precise risk control. Using specific technical tools helps traders navigate the tight drawdown limits required by professional firms.
- Spotting a bearish divergence identifies when a bullish move is losing institutional support.
- Aligning the 5-minute chart with the daily trend increases the probability of a win.
- Reducing position size during high volatility protects the account balance from rapid slippage.
- Monitoring the histogram provides visual proof of strengthening or weakening market momentum.
- Combining EMA crossovers with horizontal levels validates high-quality entry signal locations.
- Implementing a fixed risk management plan ensures that no single loss ends the challenge.
Trading for a firm demands a shift from aggressive gains to consistent accuracy. Mastery of these tools allows you to scale funded accounts safely over time. This disciplined approach is what separates professionally funded traders from retail speculators.
9. FAQs
The MACD is widely considered the top choice because it combines trend and momentum data. Many professionals pair the MACD with a 20 or 50 EMA to provide a clear directional filter. Using a combination of these indicators helps validate every trade setup. This dual-layer approach significantly improves your overall win rate.
The ideal MACD configuration depends on whether you prefer fast scalping or stable intraday moves. Beginners should stick with the 12-26-9 MACD for reliable trend identification across different pairs. Professional traders often prefer the 8-17-9 MACD to reduce entry delays. This balanced MACD setup provides faster feedback during active sessions.
This rule defines specific profit-taking levels based on the price movement of an asset. Traders often take partial profits at 3 pips, 5 pips, and final targets at 7 pips. Setting fixed profit levels helps maintain discipline during fast moves. It ensures you bank gains before a trend potentially reverses.
The 5-3-1 rule suggests focusing on 5 currency pairs, using 3 strategies, and trading for 1 hour. Limiting your focus prevents overtrading and improves mental clarity. Aligning this rule with your MACD signals creates a highly efficient workflow. Focusing on quality setups is essential for passing funding challenges.
For ultra-fast charts, use a 5-13-1 MACD setup to capture every micro trend shift. Tighter MACD inputs allow you to see momentum shifts almost instantly. This reactive MACD style is perfect for aggressive traders seeking quick entries. Always wait for EMA alignment to avoid being trapped by market noise.
A 6-13-4 MACD configuration works best for identifying micro-trends without excessive signal lag. This specific MACD setting provides a sweet spot for high-frequency traders. It offers a faster crossover trigger than the standard 12-26-9 MACD parameters. Ensure you have confirmation from a higher timeframe before entering.
For 10-minute intervals, a 10-22-9 MACD setup provides a stable view of emerging trends. Adjusting your MACD periods helps filter out minor fluctuations. This configuration ensures the MACD line stays relevant during longer intraday moves. It serves as an excellent bridge between short-term and mid-term analysis.
Standard 12-26-9 MACD inputs are highly effective for tracking the hourly flow of momentum. This classic MACD configuration provides a smoother signal for identifying reversals. It helps traders stay aligned with the broader intraday trend direction. Most technical analysis for funded accounts starts at this level.
Use a 24-52-18 MACD setup to filter out the noise of lower intervals effectively. Slow MACD settings provide higher-quality trend data for longer-term intraday positions. This approach reduces the frequency of bearish or bullish fakeouts significantly. Waiting for MACD confirmation on this chart adds weight to your bias.
Many experts find the 8-17-9 MACD to be the most accurate for 5-minute entries. This setup triggers a MACD crossover exactly as a trend begins to accelerate. It provides a faster bearish signal than default parameters during sudden drops. Testing this MACD configuration on a demo account is highly recommended.
Yes, because it uses past EMA data, but you can mitigate lag with faster inputs. Shortening the MACD slow line increases its responsiveness to current volatility. Combining a fast MACD with current price action helps traders enter moves earlier. Confirmation from a momentum indicator reduces the risk of entering too late.
Look for cases where price hits a new low while the MACD hits a higher low. A bullish divergence signals that selling pressure is fading despite lower prices. Conversely, a bearish signal occurs when price makes higher highs but the MACD does not. Identifying these patterns allows you to predict trend reversals early.
This strategy requires MACD alignment on the 5-minute, 15-minute, and 1-hour charts simultaneously. Taking trades only when all three timeframes agree maximizes your win probability. It ensures that short-term momentum aligns with the broader market trend. Note: This strategy works best in clearly trending markets. In choppy or sideways conditions, waiting for all three timeframes to confirm can lead to late entries or missed opportunities.
Yes, but you should use the 8-17-9 MACD to handle stock market gaps. Stocks often experience high volatility during the opening bell that standard settings miss. Adjusting your MACD allows you to track individual sector momentum more accurately. Align your MACD triggers with volume spikes for the best results.
10. Conclusion
Selecting the most effective MACD settings for 5 minute chart setups is essential for intraday success. Consistency in your technical approach builds the intuition needed for professional trading. Whether you prefer fast signals or balanced trend data, sticking to one system is key. Patience allows high-probability setups to form naturally within your strategy.
At H2T Funding, we provide the insights and capital to help you scale your performance. Applying these technical tools correctly helps you navigate drawdown limits with much higher precision. Master your execution and maintain a strict risk control mindset during every session.
Discover more professional techniques by exploring our Prop Firm & Trading Strategies category. Continuous education is the fastest path to long-term profitability in the global markets. Apply your optimized strategy and start your journey toward a funded account today!