It’s a frustrating feeling: you nail the direction and the strike on an options trade, but still end up losing money because your timing is off. I’ve been there.
For me, learning how to use supply and demand zones when trading options completely changed how I see the market conditions. Instead of chasing moves, you focus on areas where institutional players are likely to act. This is essentially trading using supply and demand zones in a structured way.
It’s about anchoring trades to strong buying or selling pressure, which naturally improves your risk-to-reward. No matter the strategy, calls, puts, or spreads, this analysis provides a solid technical foundation.
In this article, H2T Funding shows how mastering supply and demand zones can turn raw price action into structured opportunities for traders.
Key takeaways
- Supply zones are price areas where sellers dominate, usually found above current price levels. They act as resistance because institutions use them to unload or short positions.
- Demand zones are areas where buyers dominate, typically below current price levels. They act as support because institutions accumulate positions and push prices higher.
- These zones are most effective when confirmed with candlestick patterns, volume, or momentum indicators before entering.
- Traders can apply them to directional calls/puts, credit and debit spreads, and breakout pullbacks for better structure and consistency.
1. What are supply and demand zones in forex?
In forex trading, supply and demand zones are explained by marking the areas on a chart where strong imbalances between buyers and sellers drive sharp price moves. These zones act as footprints of institutional activity and help traders anticipate where the price is most likely to reverse or continue.
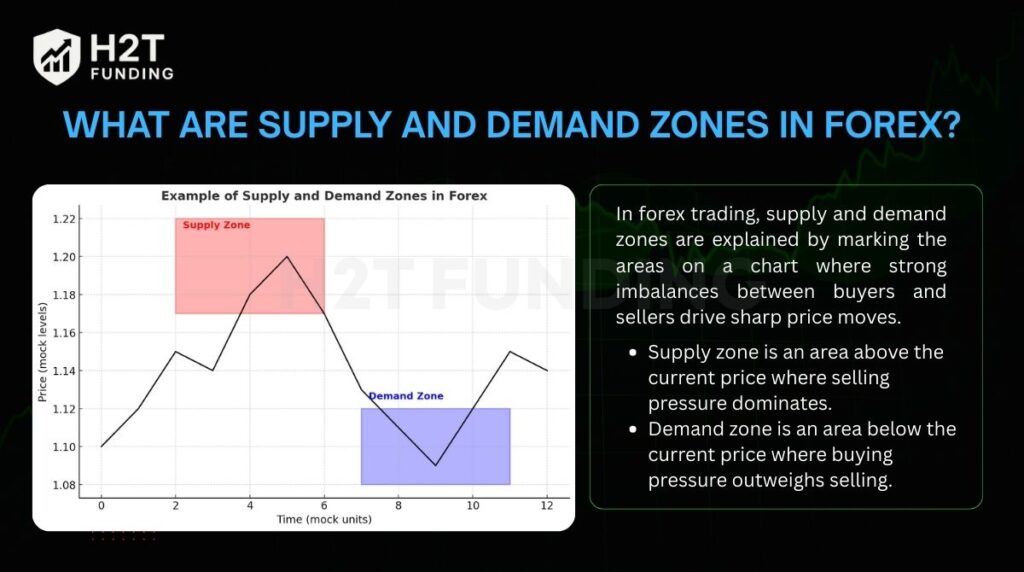
- Supply zone is an area above the current price where selling pressure dominates. It usually forms after a price rally -> price consolidations -> sharp price movements lower. When price revisits this zone, sellers often step in, creating resistance and pushing price lower.
- Demand zone is an area below the current price where buying pressure outweighs selling. It typically appears after a price drop -> consolidation -> sharp rise. When price returns to this zone, buyers jump in, forming support and driving price upward.
Unlike simple support and resistance lines, supply and demand zones are dynamic. They account for order flow, volume, and market context, making them more reliable in showing where institutional players are likely to act.
For example, imagine apples being sold at $50/kg. As more sellers raise the price to $60 or $65, buyers resist, and demand dries up. The market then drops back to $50, where buyers feel comfortable making another purchase.
On a chart, this range between $50 and $65 acts like a supply zone, while $50 itself becomes the demand zone where buying restarts.
2. Why supply and demand zones matter in options trading
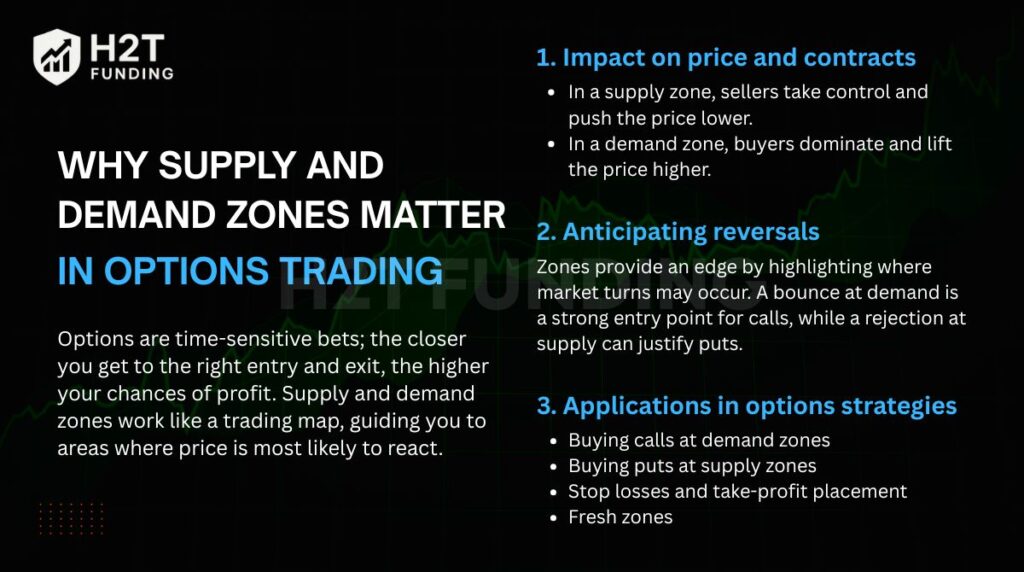
Options are time-sensitive bets; the closer you get to the right entry and exit, the higher your chances of profit. Supply and demand zones work like a trading map, guiding you to areas where price is most likely to react. This precision is vital because even with the right strike and direction, poor timing can quickly eat away at an option’s value.
2.1. Impact on price and contracts
Understanding how zones affect both underlying price action and option premiums is key. These areas determine not only where the market might turn, but also how option contracts gain or lose value in real time. Especially when observing trading volume and unusual options block trades that often foreshadow big moves.
- In a supply zone, sellers take control and push the price lower. This is the moment when put options and bear call spreads become attractive setups.
- In a demand zone, buyers dominate and lift the price higher. These conditions favor call options and bull put spreads.
- As prices near these zones, volatility often spikes, making options premiums more expensive as traders brace for movement.
2.2. Anticipating reversals
Zones provide an edge by highlighting where market turns may occur. A bounce at demand is a strong entry point for calls, while a rejection at supply can justify puts. Traders gain by preparing before the crowd reacts, instead of chasing after the move has started.
2.3. Applications in options strategies
- Buying calls at demand zones: strong buyer interest creates upward momentum; confirmation from candlestick patterns or volume strengthens the setup.
- Buying puts at supply zones: selling pressure at resistance levels increases the odds of success for puts.
- Stop losses and take-profit placement: zones make risk management easier. Stops can be placed below demand or above supply, limiting losses if zones fail.
- Fresh zones: first-time retests of a zone are usually stronger, offering higher-probability trades than zones that have been touched multiple times.
Using supply and demand is one of the best trading strategies for beginners because it simplifies decisions with clear entry and exit rules.
Pros and cons of using supply and demand zones in options
| Pros | Cons |
|---|---|
| Provide clear entry and exit levels, reducing guesswork. | Zones weaken after multiple retests and may fail. |
| Improve risk-to-reward ratios by defining stop and target points. | Sudden news or high-impact events can break even strong zones. |
| Useful across strategies: 0DTE, weekly, spreads, and directional plays. | Require confirmation signals; acting blindly can lead to false entries. |
| Help traders anticipate reversals before they happen. | Not every zone reflects institutional activity; weak zones can mislead. |
Supply and demand zones give option traders a structured framework for trading volatility. They don’t eliminate risk, but they turn trading from guesswork into a disciplined process, with clearer timing, better setups, and stronger risk management.
3. How to identify supply and demand zones on a chart
The most effective way to spot supply and demand zones is through a candlestick chart. These zones appear where price made a sharp, decisive move, signaling the presence of unfilled institutional orders. Identifying them allows traders to anticipate where the price is likely to react again.
How to recognize zones:
- Price drops strongly from a level -> supply zone.
- Price rallies sharply from a level -> demand zone.
- Look for large candles, gaps, or clusters showing clear imbalance, often linked to hidden liquidity pools.
Timeframes to consider:
- For intraday trading, focus on 15-minute and 1-hour charts to capture short-term moves.
- For swing trading, higher frames like 1-hour, 4-hour, and daily charts reveal stronger, longer-lasting zones.
- Combining timeframes is powerful: spot the zone on a daily chart, then refine entries using a 15-minute chart for precision.
Technical tools to support identification
- Rectangle drawing: mark the base where the sharp move started, stretching from the proximal line (nearest candle edge) to the distal line (swing high or low). This is considered the best approach for anyone learning how to set supply and demand zones effectively.
- Volume profile: rising volume near a demand zone signals fresh buying interest; heavy volume at supply shows selling pressure. This is a reliable way to practice how to use supply and demand indicator alongside price action.
- Candlestick confirmation: bullish engulfing or pin bars strengthen demand zones, while bearish engulfing or rejection wicks confirm supply zones.
- Trend lines and moving averages: help filter zones that align with the broader market direction, improving reliability.
Identifying supply and demand zones means looking for sharp rallies or drops on candlestick charts, then marking the base of those moves with rectangles. Traders confirm these areas by checking volume analysis or price action.
With this approach, they can filter out weak zones, focus on high-probability ones, and plan more accurate entries.
Continue reading: What are the 4 trading sessions? A beginner’s guide
4. How to use supply and demand zones when trading options
Supply and demand zones are flexible tools that can adapt to different option strategies. If you’re wondering how to trade using supply and demand, start by aligning entries with zones and then add confirmation for timing.
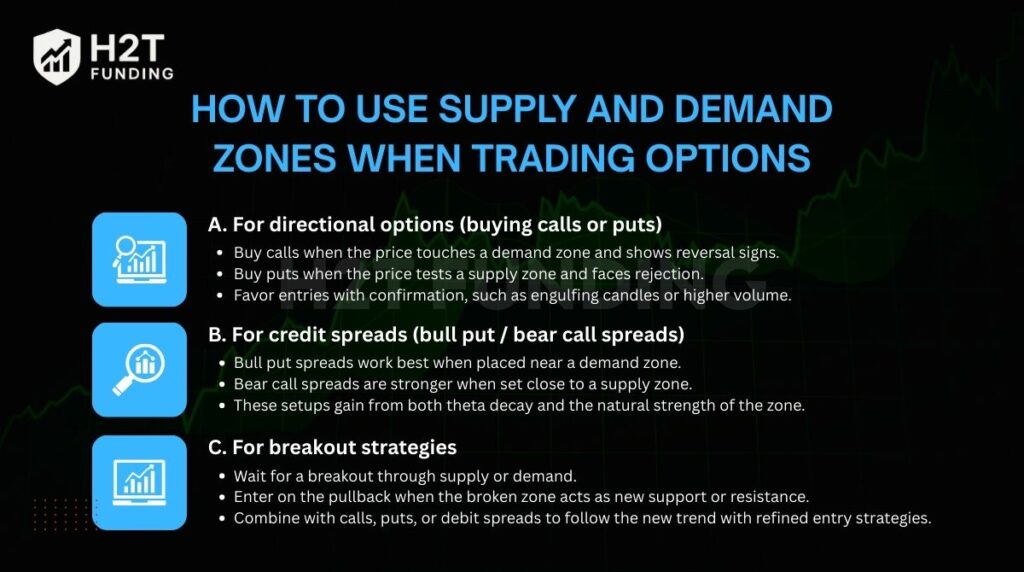
4.1. A. For directional options (buying calls or puts)
Directional traders can use zones to align their trade entries with areas where the price is most likely to reverse. This approach reduces random entries and improves confidence in setups.
- Buy calls when the price touches a demand zone and shows reversal signs.
- Buy puts when the price tests a supply zone and faces rejection.
- Favor entries with confirmation, such as engulfing candles or higher volume.
4.2. B. For credit spreads (bull put / bear call spreads)
Spreads benefit from zones because they combine probability with structural support and resistance. Positioning spreads near these areas improves the chance that the price will stay within your profit range.
- Bull put spreads work best when placed near a demand zone.
- Bear call spreads are stronger when set close to a supply zone.
- These setups gain from both theta decay and the natural strength of the zone.
4.3. C. For breakout strategies
Not every zone holds; sometimes, price breaks through with strong momentum. Breakout traders can still use zones to find safe re-entries after the move.
- Wait for a breakout through supply or demand.
- Enter on the pullback when the broken zone acts as new support or resistance.
- Combine with calls, puts, or debit spreads to follow the new trend with refined entry strategies.
In summary, supply and demand zones give option traders a reliable map to structure trades. Whether you are buying calls, selling spreads, or trading breakouts, using these zones ensures your decisions are based on proven price dynamics rather than guesswork.
5. How to draw supply and demand zones?
Supply and demand zones can be drawn by tracking sharp price moves and marking their origin. This process helps traders visualize where strong buying or selling pressure appeared in the past. Let’s walk through the steps to see how these zones are identified on the chart.
5.1. Drawing a demand zone
A demand zone forms after a strong rally, where buyers entered aggressively.
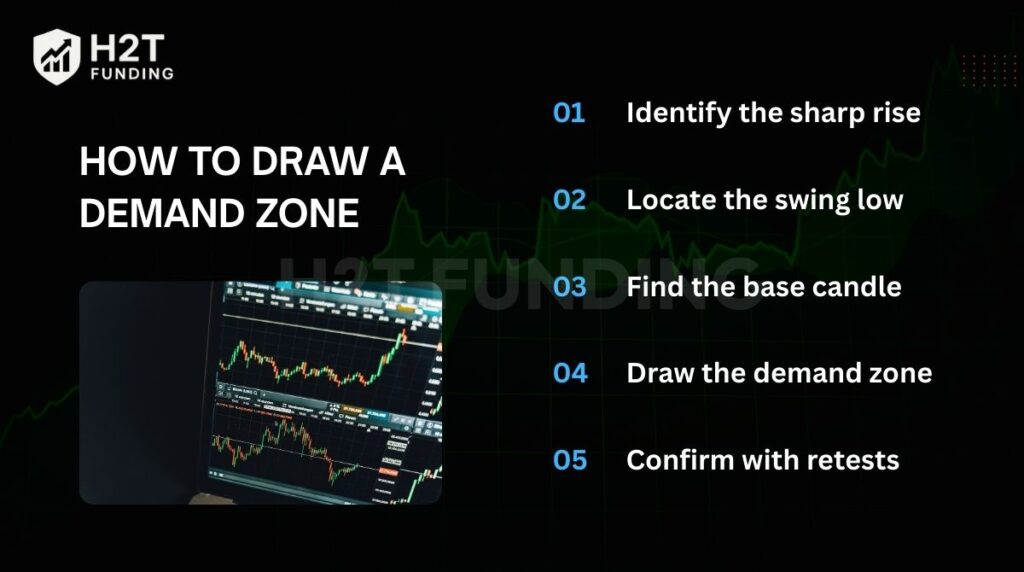
Steps to draw a demand zone:
- Step 1: Identify the sharp rise: Look for a strong rally on the chart, often marked by consecutive bullish candlesticks. The steeper and faster the move, the stronger the buying imbalance.
- Step 2: Locate the swing low: Pinpoint the most recent swing low before the rally started. This marks the point where bearish momentum exhausted, and large buyers entered.
- Step 3: Find the base candle: The “base” is the small candle (bullish or bearish) just before the explosive move. It represents the last opportunity for institutions to fill buy orders before demand overwhelms supply.
- Step 4: Draw the demand zone: Create a rectangle from the open/close of the base candle (proximal line) down to the swing low (distal line). This zone visually highlights where strong accumulation occurred.
- Step 5: Confirm with retests: Demand zones are validated when price revisits them and reacts with bounces, pin bars, or bullish engulfing patterns. The fresher the zone (few retests), the higher its probability of holding.
5.2. Drawing a Supply Zone
A supply zone forms when sellers dominate, forcing the price to decline rapidly. Institutions use these levels to unload positions or open shorts at premium prices, creating what is known as a distribution area.
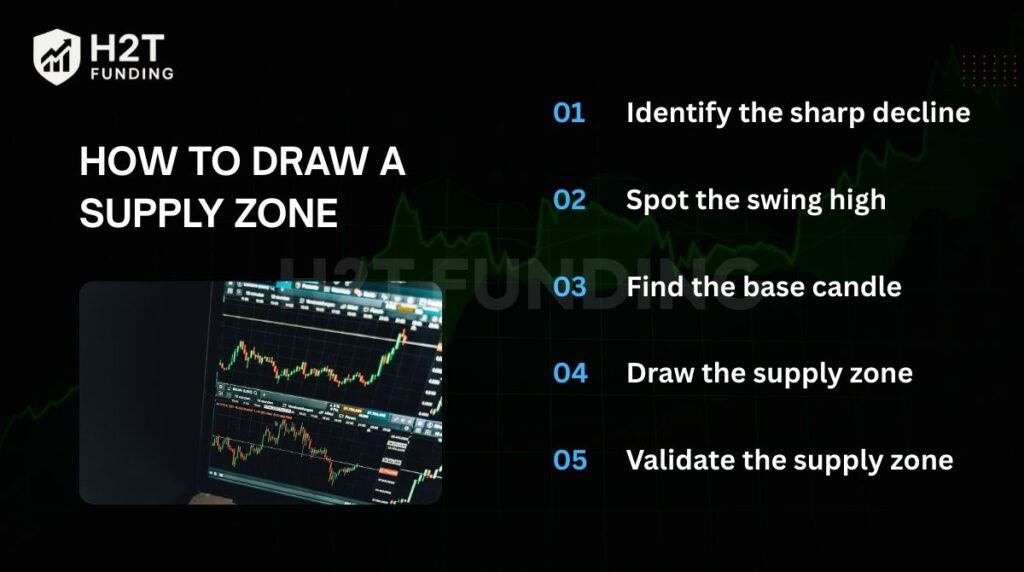
Steps to draw a supply zone:
- Step 1: Identify the sharp decline: Look for a steep drop with multiple bearish candles. This reveals a heavy sell imbalance where supply far outweighs demand.
- Step 2: Spot the swing high: Mark the most recent swing high before the decline began. This is where bullish enthusiasm peaked before institutional selling started.
- Step 3: Find the base candle: The base is the last small candle right before the strong bearish move. It shows the final phase of distribution, where big players positioned themselves short.
- Step 4: Draw the supply zone: Extend a rectangle from the base candle (proximal line) up to the swing high (distal line). This defines the overhead zone where sellers are likely to reappear.
- Step 5: Validate the supply zone: Confirmation comes when price retests the area and shows rejection, long upper wicks, bearish engulfing bars, or increased volume. Multiple failed attempts to break higher reinforce the strength of the zone.
Pro Tip: Both supply and demand zones work best when combined with confirmation tools such as candlestick patterns (pin bars, engulfing), volume spikes, or momentum indicators. Remember that zones lose strength after multiple retests, so prioritize “fresh” zones with the cleanest reactions.
6. Real-life examples of supply and demand analysis in practice
Supply and demand zones shine when you test them on live charts. The cases below show how zones form, why price reacts, and how to translate that into clear option plans without guesswork. Each example keeps entries, exits, and invalidations explicit.
6.1. Example 1: USD/JPY – 1H demand zone during a pullback
In trending markets, it’s not always clear whether a pullback is simple profit-taking or the start of new positioning. On the USD/JPY 1-hour chart, the price fell sharply, paused with a small base candle, and then surged upward. This created a demand zone where institutional buying became visible.
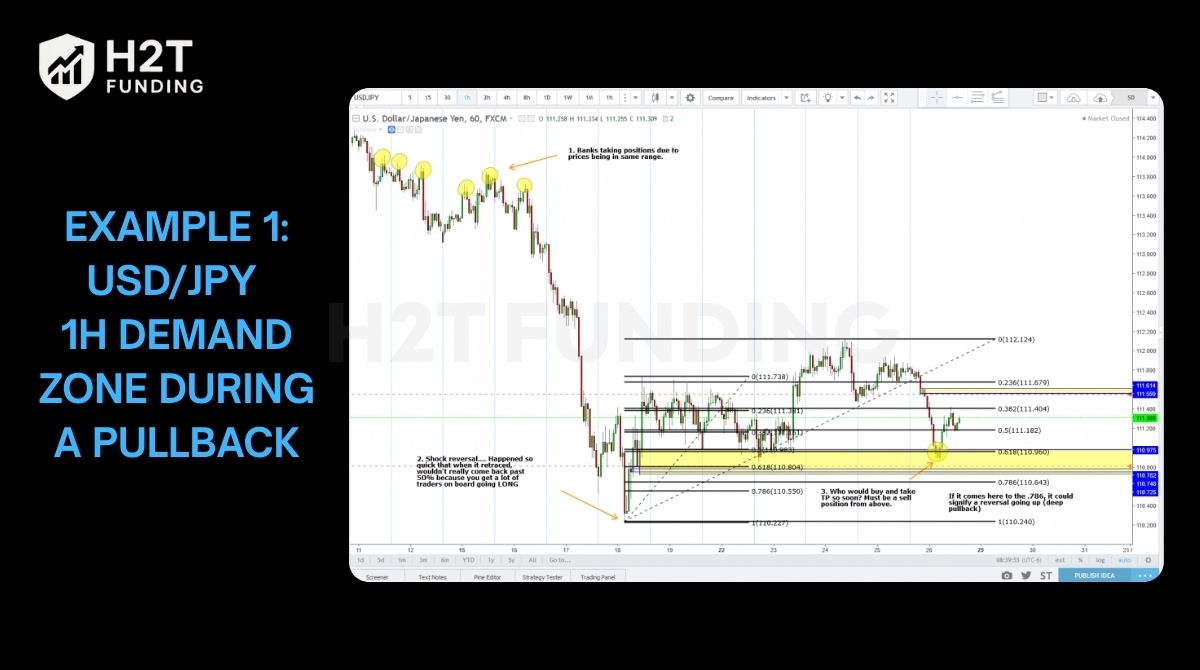
When price revisited the zone, some traders were skeptical because the base candle looked like a bearish pin bar. In reality, the shape of the candle matters less than the reaction that follows. That pin bar likely represented short sellers locking in profits, just before larger buy orders pushed the market higher.
On the retest, price bounced decisively, confirming that institutions had not completed their buying in the first move. For an options trader, this was a clear place to buy calls or structure a bull put spread, placing a stop just below the distal line of the zone. The trade setup combined limited risk with high-probability timing.
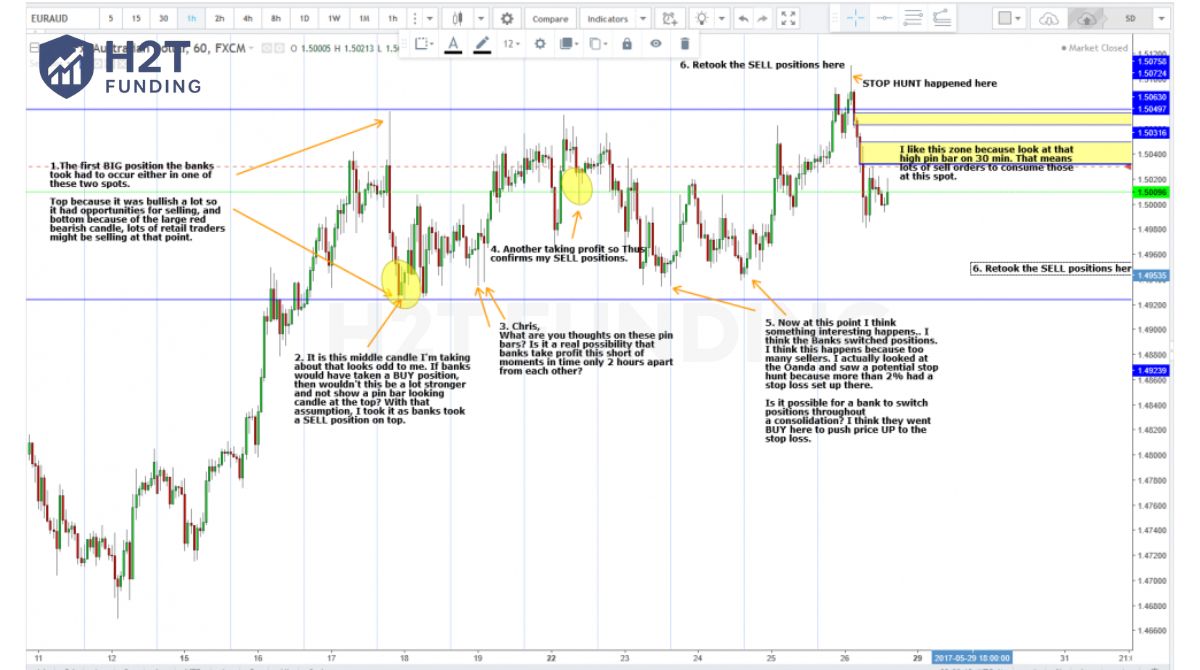
What stands out here is a lesson I had to learn the hard way: don’t overanalyze the “perfect look” of a zone. It’s easy to get fixated on the candle pattern inside the base, but the real story is in the energy of the move away from it. That powerful departure is the true signature of institutional orders.
These days, I care a lot more about a strong, clean move away from a zone and how price reacts on the first retest than I do about a textbook-looking candle.
This USD/JPY case shows that trusting the imbalance behind the move and broader market trends is more important than fixating on a single candlestick. Traders who understood this principle positioned early and enjoyed a stronger edge than those waiting for more obvious confirmation.
6.2. Example 2: XAU/USD Daily–H4–1H multi-timeframe zone analysis
Gold (XAU/USD) is a strong case of how supply and demand zones reveal institutional footprints across multiple timeframes. On the daily chart, a wide demand zone formed after an extended rally. Price revisited this area multiple times, each bounce suggesting that large buy orders had not been fully executed in the initial move.
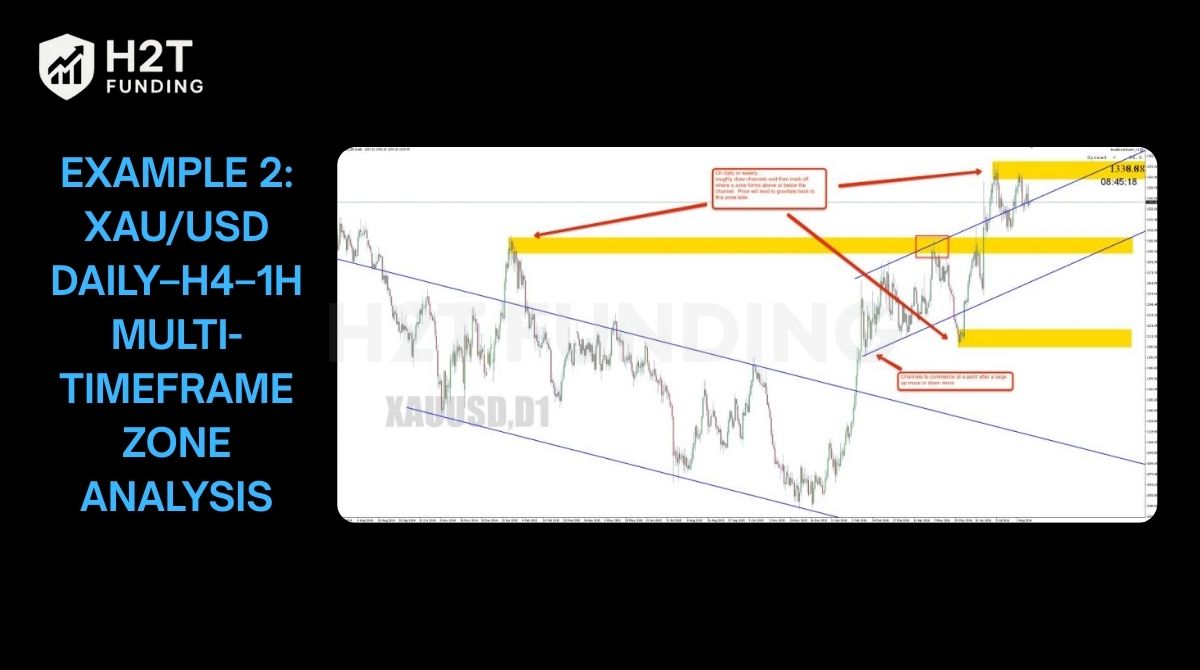
When drilling down to the H4 chart, price action showed compression into the demand zone followed by sharp rejections. These repeated reactions indicated that banks were layering entries over several retests, a behavior often seen when institutions cannot fill all orders at once.
Meanwhile, supply zones above lost influence after the market structure flipped bullish, making them less reliable.
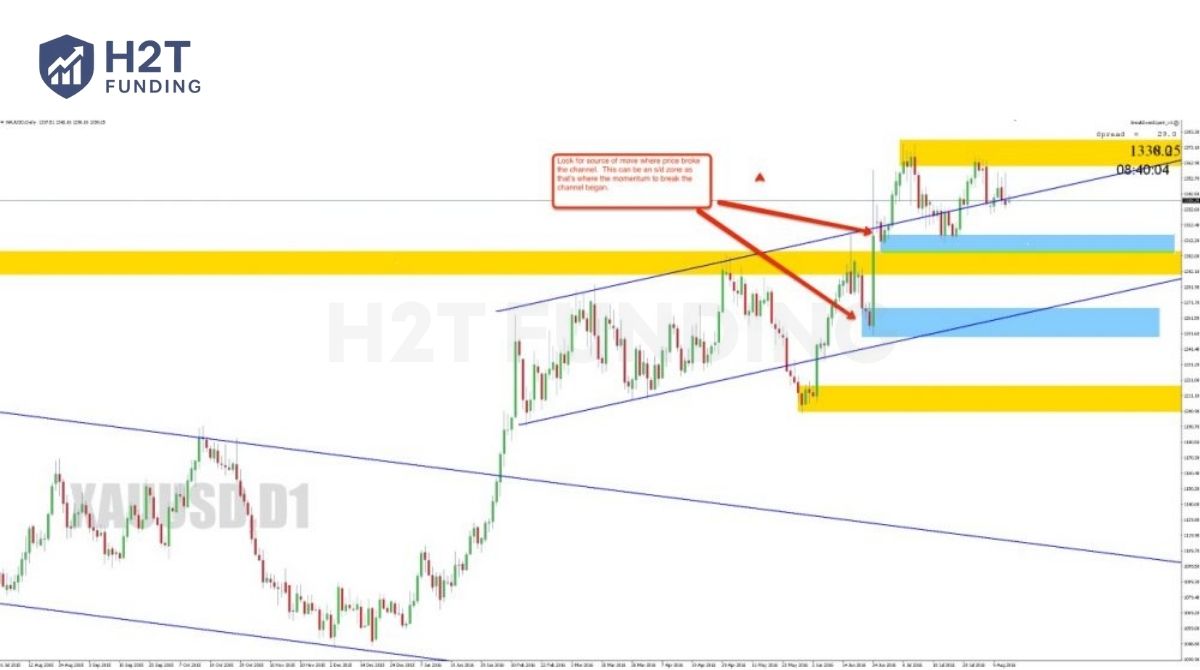
On the 1H chart, zones became even clearer. Each rejection from demand aligned with bullish engulfing candles, while supply zones acted as temporary barriers but failed to reverse the overall trend. The channels drawn on this timeframe appeared less relevant; what truly drove price was the zones themselves. Relying too much on channels risked adding noise rather than clarity.
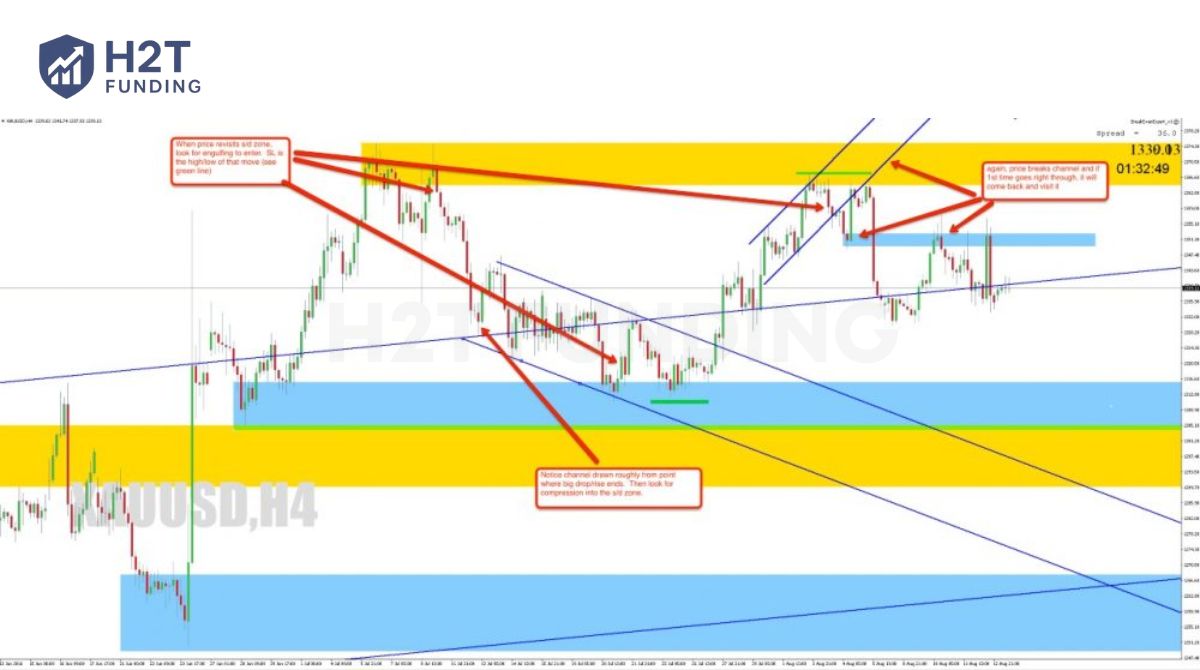
This example is a great reminder of why keeping charts simple is so effective. It’s tempting to draw channels and trendlines everywhere, but as you can see here, they often just add noise while the market clearly respects the zones.
My approach has evolved to focus on the cleanest zones first, the ones with that powerful move away. Everything else is secondary. It helps you stay aligned with institutional order flow instead of getting lost in every line you draw.
6.3. Example 3: Nifty 50 & Bank Nifty – Layered supply, major demand below
The Nifty 50 and Bank Nifty often move in tandem, though one index sometimes leads the other. This correlation makes supply and demand zones on both charts especially important for confirming trade ideas.
In this example, multiple retests of a minor demand zone in Nifty raised questions about whether banks were closing sell positions or preparing for new buys.
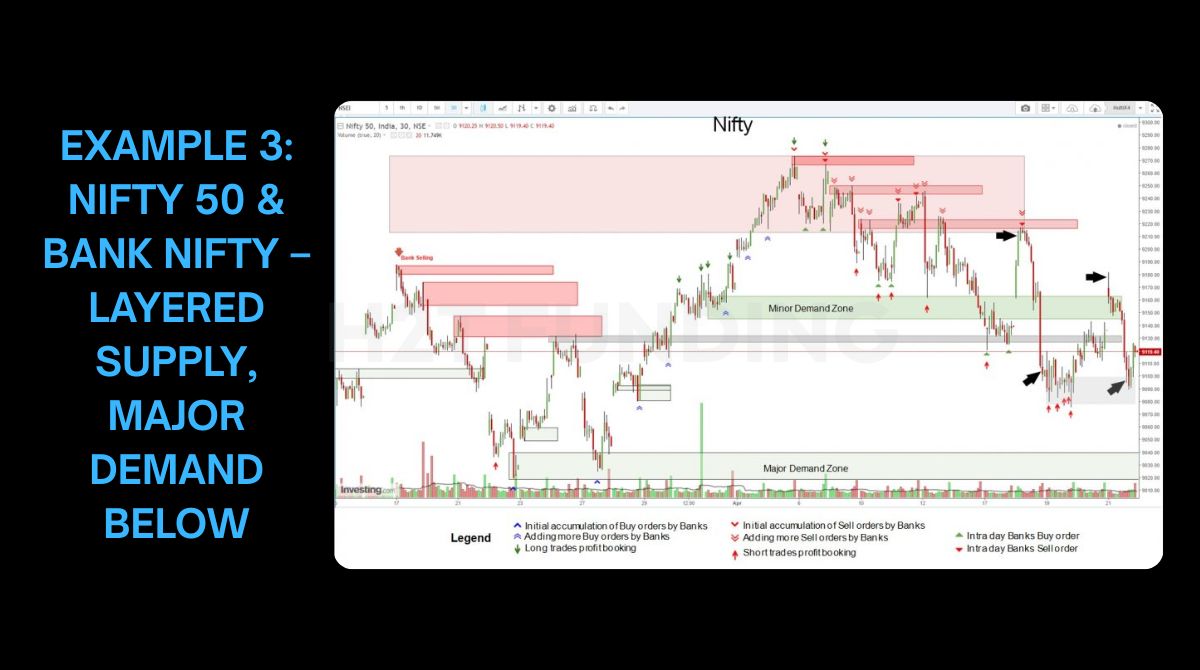
Price action showed repeated touches of the minor demand zone, while supply zones above were hit multiple times, hinting that banks were layering sell orders at those levels.
Normally, heavy supply zone interaction can weaken demand beneath. Yet, the market did not collapse immediately, suggesting that institutions might still be balancing their books rather than driving a trend reversal.
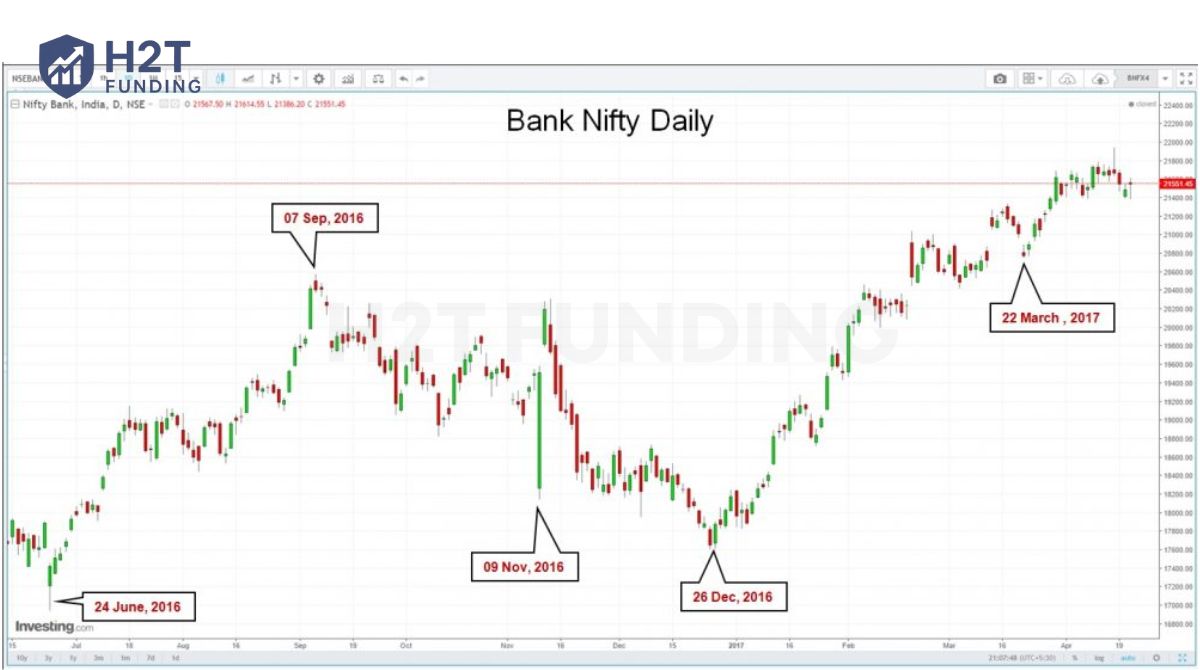
Looking at Bank Nifty Daily, the correlation becomes clearer. The index had recently risen strongly from an earlier demand zone, confirming that banks had already established significant long positions. This structure hinted that any retracement into demand would more likely serve as accumulation rather than a full-blown reversal.
On the Bank Nifty Hourly, supply zones capped the price several times, creating a ceiling. However, demand zones beneath showed strong rejections with bullish candles. This pattern suggested institutions were scaling into longs during pullbacks, even as overhead supply created short-term resistance.
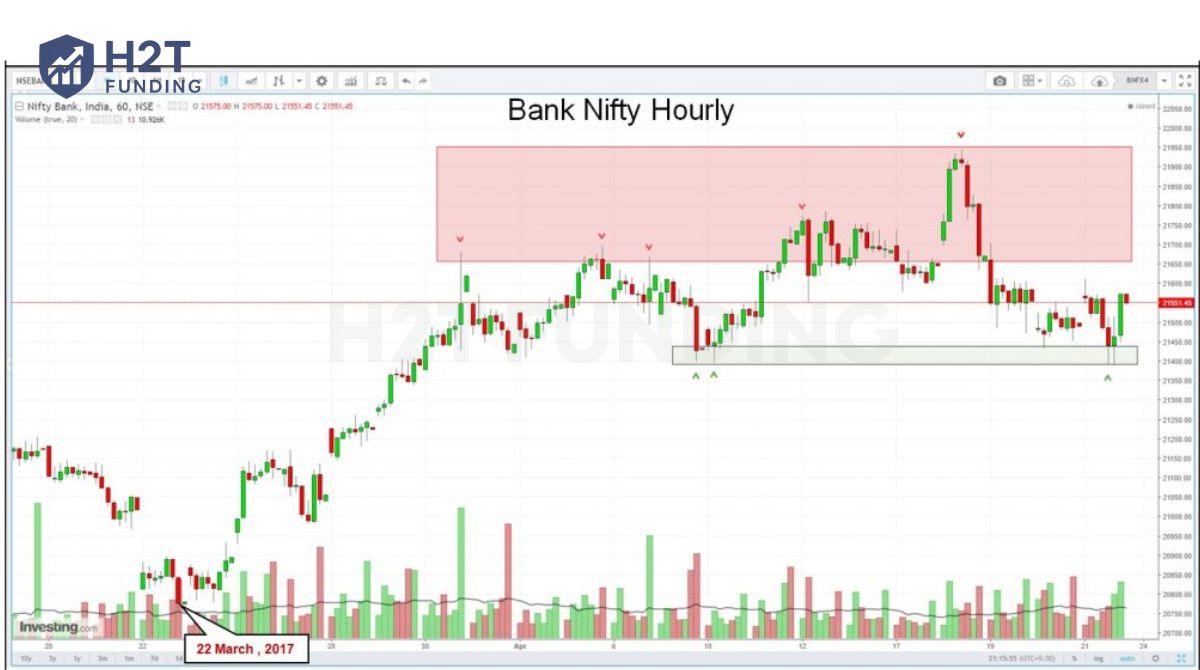
What stands out is the repeated interaction with zones. Many traders assume multiple touches mean a zone will break soon. But in correlated instruments like Nifty and Bank Nifty, repeated tests can also indicate that institutions are gradually filling large orders.
Shorting into a major demand zone is like fighting a strong current; it’s a low-probability trade. A smarter move is to wait for a bullish reversal inside the zone, ideally confirmed by a volume spike. That’s your signal that institutions are likely defending their positions, preparing for the next move up.
Across these examples, one thing stands out: supply and demand zones reveal where institutions act. Traders should focus on spotting and validating these zones instead of chasing moves. This approach creates a structured edge, turning volatility into clearer opportunities with defined risk.
7. Risk management when using supply/ demand zones
Using supply and demand zones can give traders an edge, but no zone works every time. The key to long-term success is combining zone analysis with disciplined risk management. Without it, even the best setups can quickly turn into losses.
- Always wait for confirmation: Not every touch of a zone leads to a reversal. Look for signs like bullish engulfing at demand or bearish rejection at supply before entering. Blind entries often result in unnecessary losses.
- Stop-loss placement: Always use stops. Place them just below demand zones when buying or above supply zones when selling. This protects capital if the zone fails, while leaving room for normal price fluctuation.
- Risk-to-reward ratio: Ensure each trade offers at least a 1:2 ratio. If risking $100, aim for a minimum $200 return. Skipping trades that don’t meet this threshold avoids poor-quality setups.
- Control position size: Keep risk per trade limited to 1–2% of account equity. This prevents a series of losing trades from causing significant drawdowns.
- Avoid FOMO: Don’t chase price once it’s far from the zone. Late entries often mean smaller profit potential and higher risk. Wait patiently for the next setup.
- Protecting profits: Combine fixed take-profit targets with trailing stops. Targets lock in gains at logical levels, while trailing stops adapt to shifting economic dynamics.
Supply and demand zones only become powerful tools when combined with strict risk management. Confirmation signals, smart stop placement, and discipline ensure that even when zones fail, your account remains protected and ready for the next opportunity.
8. 8 tips to improve accuracy when using zones in options trading
Supply and demand zones work best when traders learn to filter out weak levels and focus on the ones with true institutional weight. By combining price action with confirmation tools and disciplined trade management, options traders can improve both accuracy and consistency.
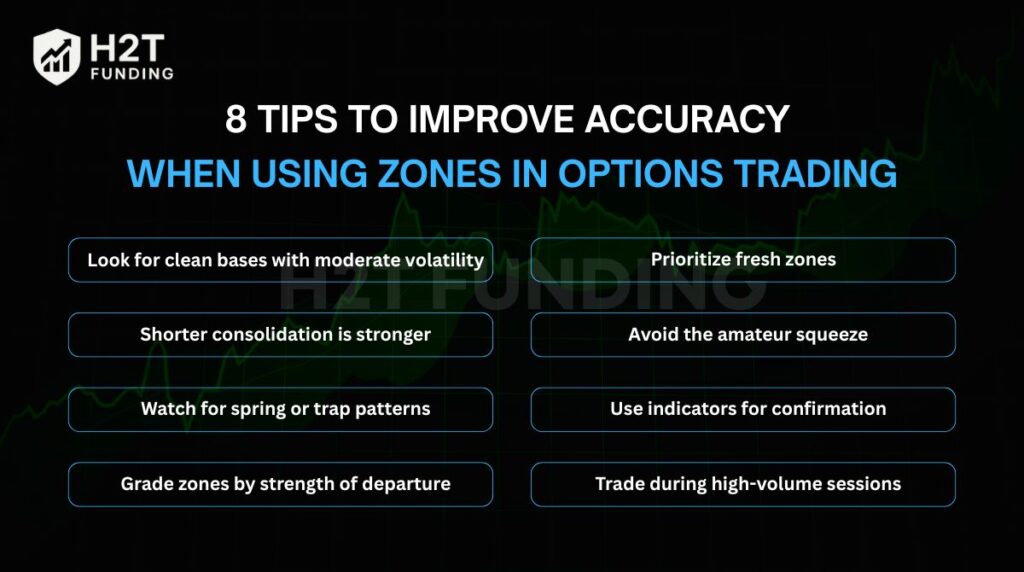
8.1. Look for clean bases with moderate volatility
High-quality zones usually form after a narrow consolidation followed by an explosive breakout. If the base shows too many wicks or messy back-and-forth, avoid it. In options trading, these noisy levels often fail quickly and eat away at time value.
8.2. Shorter consolidation is stronger
A supply or demand zone is more reliable if the price spent little time building it before breaking away. Brief bases reflect urgency by institutions, making the zone more likely to hold on to retests. For option spreads, this raises the chance of the price staying inside your profit range.
8.3. Watch for spring or trap patterns
Sometimes, price fakes a move opposite to the breakout, known as a “spring.” This trap lets institutions load up before reversing the market. Spotting such setups around zones allows option traders to time entries with calls or puts just as retail traders are shaken out.
8.4. Grade zones by strength of departure
The sharper and more decisive the move away from a zone, the stronger it is. Explosive candles or gap-like moves show real imbalance. In options, these zones give the best strike selection opportunities since momentum favors quick gains.
8.5. Prioritize fresh zones
The first touch of a zone is the most powerful. Each revisit consumes unfilled orders and weakens its edge. For options, trading the first or second test ensures you are not wasting premium on exhausted levels.
8.6. Avoid the amateur squeeze
Many retail traders place stops too close or enter blindly at a zone. Price often overshoots before reversing, creating false breakouts. Waiting for confirmation, like a pin bar, engulfing candle, or volume spike, helps avoid these traps and improves win rate.
8.7. Use indicators for confirmation
Adding RSI, MACD, or volume helps validate supply and demand zones. Oversold RSI near demand or bearish divergence at supply adds confluence, making entries more reliable for options setups.
8.8. Trade during high-volume sessions
Zones hold better when liquidity is high, such as during the US open, earnings reports, or FOMC releases. Timing trades in these windows ensures your options react quickly instead of decaying in slow, low-volume markets.
Improving accuracy with supply and demand zones is less about drawing more lines and more about filtering for quality. Clean bases, strong breakouts, and fresh retests give traders the highest edge, while confirmation from indicators and volume boosts reliability.
For option traders, applying these principles means fewer false entries, stronger timing, and strategies that align closely with institutional flows.
9. Common mistakes when using supply/demand zones
Even though supply and demand zones provide a powerful framework, many traders misuse them and end up with poor results. Understanding the most frequent errors helps avoid costly mistakes, especially in options where time decay magnifies bad entries.
9.1. Overtrading minor zones
One common mistake is treating every swing high or low as a valid zone. Weak or poorly defined areas lack institutional orders and often fail quickly. For options traders, entering at these spots wastes premium and increases the chance of stop-outs.
9.2. Ignoring the broader trend
Focusing only on small zones without considering the overall market trend can lead to trading against momentum. A demand zone in a strong downtrend, for example, is less likely to hold. In options, this often means buying calls in a bearish environment, which erodes value faster.
9.3. Not adapting to changing conditions
Markets evolve, and zones lose strength after multiple retests or major news events. Traders who fail to update their analysis risk relying on outdated levels. For options, this translates into holding losing spreads or directional plays long after the edge is gone.
9.4. Poor risk management
Another frequent error is risking too much on a single zone. Even the cleanest setups can fail. Without predefined stops or proper position sizing, traders risk large drawdowns. In options trading, this can mean total premium loss if the zone breaks.
Supply and demand zones are effective only when used with discipline. Traders must filter for high-quality levels, align with the bigger trend, adapt when conditions shift, and apply strict risk management. Doing so keeps trades consistent and preserves capital for the next valid setup.
10. Supply and demand forex trading strategies
Trading with supply and demand zones means spotting imbalances and picking the right approach for the context, range, or breakout. It is better than trading on random predictions.
10.1. Range trading strategy
When price oscillates between supply and demand zones, traders can take advantage of the consolidation seen on price charts. At the upper boundary, strong selling pressure often emerges as institutions distribute positions. At the lower boundary, fresh buy orders tend to accumulate, leading to rebounds.
For example, during a sideways market, selling near supply and buying near demand can produce multiple short-term trades. The key is to watch volume and candle confirmation, since zones weaken after too many retests. Options traders can mirror this approach with bear call spreads near supply and bull put spreads near demand.
10.2. Breakout strategy
Markets rarely stay inside a range forever. When momentum builds, price often breaks out from a zone with force. A breakout above demand suggests new buying pressure, while a breakdown from supply reflects heavy selling.
Indicators like RSI or Stochastic can provide extra confirmation. An overbought reading at supply strengthens the case for a reversal, while oversold signals at demand suggest a bullish breakout is coming. Traders who time these breakouts correctly can ride large moves with calls, puts, or directional spreads.
Both range and breakout strategies use the same foundation: supply and demand zones reveal where big orders sit, highlighting the best trading opportunities. The choice depends on market context; consolidating markets reward range plays, while trending conditions favor breakouts.
11. FAQs
Yes, when you trade from high-quality zones with confirmation and strict risk controls. First touches, strong “move-away,” and fresh levels tend to produce cleaner reactions. Pair that with appropriate DTE and position sizing, and expectancy typically improves, though nothing guarantees wins.
Use higher timeframes for bias (H1/H4/Daily) and lower timeframes for entries (M5/M15 for 0DTE; M15/H1 for intraday; H1/H4 for swings). The higher timeframe marks the “big” zone; the lower timeframe gives precise triggers and tighter risk.
Yes, especially with options where timing and decay matter. Look for rejection wicks, engulfing candles, a shift in structure, or a volume pop. You may miss the occasional early move, but confirmation generally reduces false starts and improves risk-adjusted results.
Absolutely. Bull put spreads align well with demand zones; bear call spreads align with supply. Debit spreads fit breakout-pullback plays after a zone breaks and flips; choose strikes so the short leg sits outside the zone to benefit from structure and theta.
They solve different problems. Zones tell you where to trade; indicators help with when (momentum/overbought/oversold). Combining zones with RSI/MACD/volume often yields clearer entries than using either alone.
By default, supply is bearish (overhead resistance) and demand is bullish (support). If the price closes cleanly through a zone and retests it from the other side, the zone can flip, former supply becomes support, and vice versa.
Track whether demand zones hold and produce higher highs/lows (bullish) or supply zones cap price and create lower highs/lows (bearish). Confirm with breadth/volume and higher-timeframe closes through zones. Consistent respect of one side’s zones usually signals the active trend.
12. Conclusion
Ultimately, supply and demand zones offer a map for your trading. They provide a technical edge that applies whether you’re trading weeklies, directional plays, or complex spreads. The goal isn’t to win every trade, but to build a consistent edge by moving away from guesswork and toward a repeatable process.
Master how to use supply and demand zones when trading options, and you’ve built a solid foundation for your options trading.
For more advanced insights, explore our Prop Firm & Trading Strategies section on H2T Funding, where we cover practical methods to strengthen your trading foundation and scale with confidence.