Ever stared at a price chart, feeling like you’re trying to read a foreign language? You’re not alone. The chaotic zig-zags of the market can be intimidating. But what if you had a set of tools designed to translate that chaos into clear, actionable signals? Technical indicators are specifically designed for this purpose.
Our objective here is to filter out the static and focus on what truly matters. This isn’t just another list of definitions. This is a practical guide built on real-world experience to show you how to trade using indicators: not just what they are, but how to think with them, combine them, and build a trading strategy that actually makes sense.
Key takeaways:
- Indicators analyze historical data to identify trends and potential trading opportunities.
- Master how to trade using indicators by knowing the four main types: Trend, Momentum, Volatility, and Volume.
- Remember, indicators are lagging, no single indicator is perfect, and market context is crucial.
- Avoid common mistakes like backtesting a strategy, forgetting risk management, and using too many indicators at once.
- The best strategy is to combine complementary indicators for confirmation, not to rely on just one.
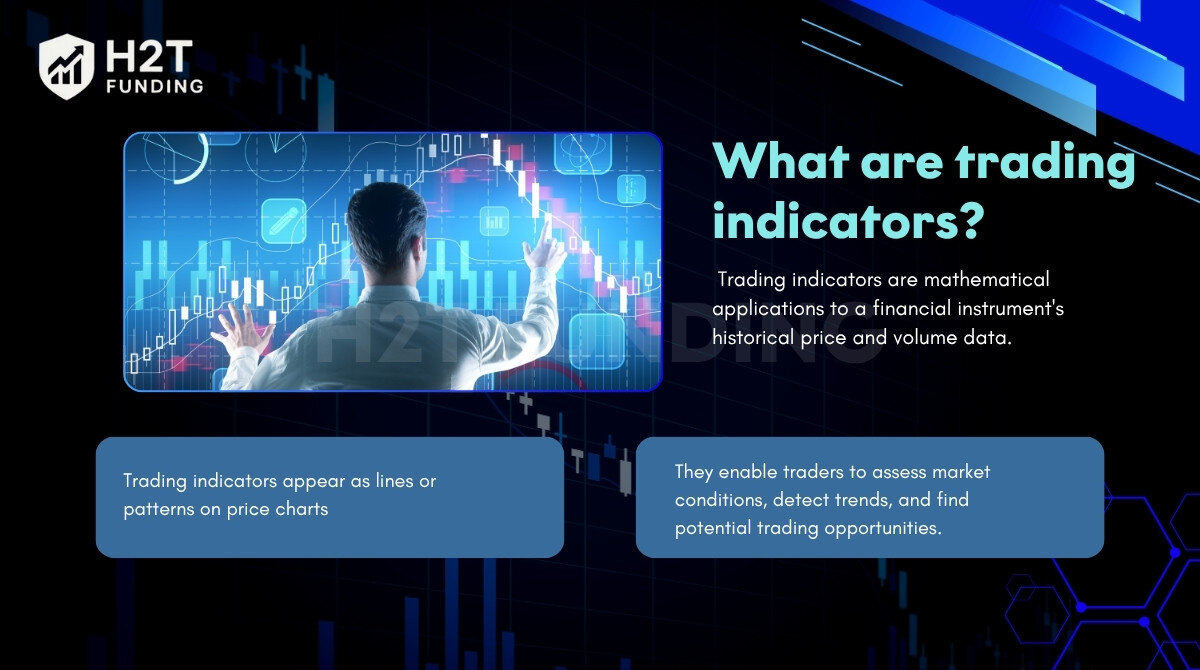
1. What are trading indicators?
In simple terms, trading indicators are mathematical applications to a financial instrument’s historical price and volume data. Appearing as lines or patterns on price charts, they enable traders to assess market conditions, detect trends, and find potential trading opportunities.
Think of it this way: a doctor doesn’t just look at a patient and guess what’s wrong. They use tools like a stethoscope or a blood pressure monitor to get objective data. As a trader, indicators are your diagnostic tools for assessing the market’s health and momentum.
2. The strategic advantages of trading with indicators
Before learning how to trade with indicators, we should answer a key question: Why bother with these tools? The reason is that a good indicator strategy can bring much-needed structure and objectivity to your trading. Here’s what they do for you:
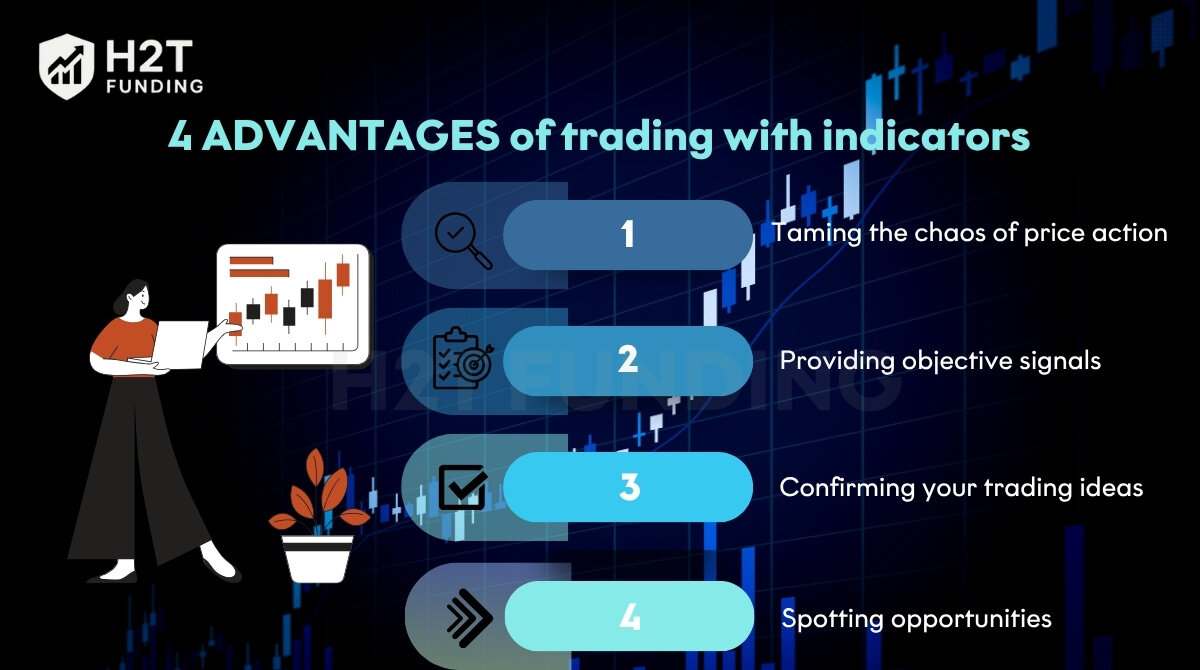
- Taming the chaos of price action: They smooth out erratic price movements, helping you see the underlying trend more clearly.
- Providing objective signals: They give you specific, rule-based criteria for entering or exiting a trade, which is your best defense against emotional decisions like fear and greed.
- Confirming your trading ideas: An indicator can act as a second opinion, confirming that a trend is as strong as you think it is.
- Spotting opportunities: They excel at highlighting potential turning points in the market, such as when an asset is overbought or oversold.
3. 4 types of trading indicators
Indicators aren’t a one-size-fits-all solution. They belong to different families, each with a specific job. Understanding these groups is the first step to using them correctly.
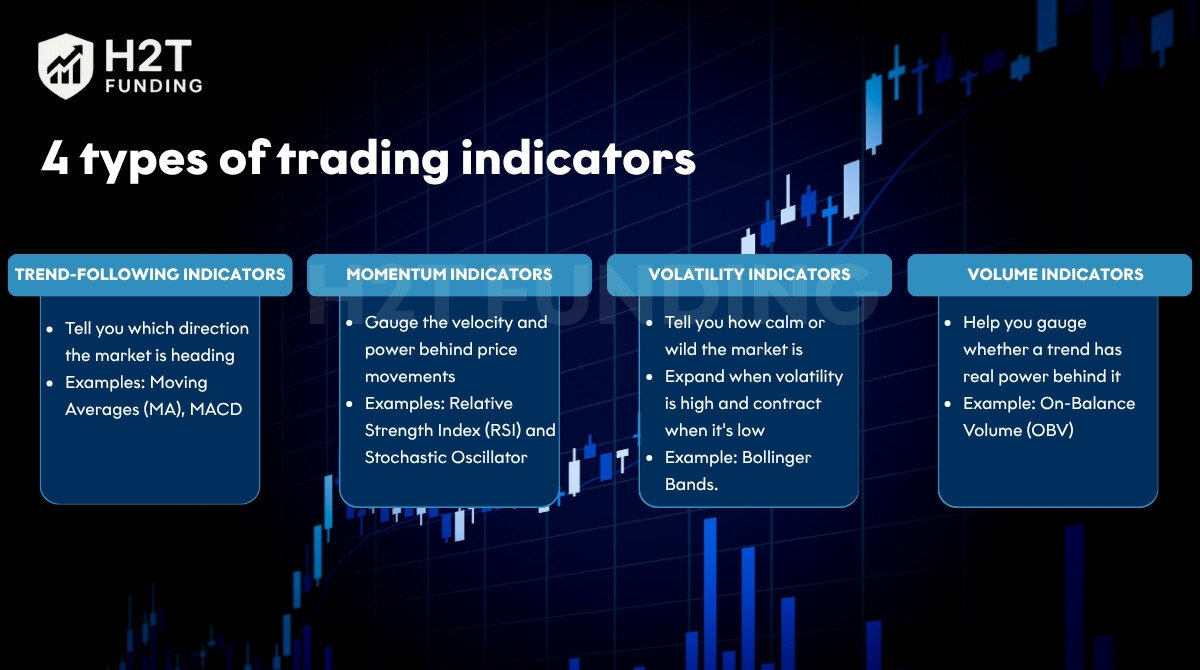
- Trend-Following Indicators: Their job is simple: to tell you which direction the market is heading. Examples: Moving Averages (MA), MACD.
- Momentum Indicators: Their job is to gauge the velocity and power behind price movements. Familiar tools such as the Relative Strength Index (RSI) and Stochastic Oscillator fall into this category.
- Volatility Indicators: These tell you how calm or wild the market is. They expand when volatility is high and contract when it’s low. Example: Bollinger Bands.
- Volume Indicators: Volume confirms the conviction behind a price move. These indicators help you gauge whether a trend has real power behind it. Example: On-Balance Volume (OBV).
4. Foundational principles for using any trading indicator
Let’s start with a crucial reality check that most new traders, unfortunately, ignore. Before you even think about adding an indicator to your chart, you need to understand these fundamental principles. Internalizing them will save you from a world of frustration.
4.1. Indicators are a rearview mirror, not a crystal ball
Most indicators are lagging. They are built using past price data, so they can only confirm what has already started to happen. They don’t predict the future. Price action always moves first.
4.2. There is no “holy grail” indicator
This is the single biggest trap. Every single indicator is flawed and will produce losing signals. Your job isn’t to find a perfect indicator; it’s to have a plan for what to do when your indicator is wrong (that’s called risk management).
4.3. Market context is king
A trend-following indicator like a Moving Average will be your best friend in a strong, trending market. But in a choppy, sideways market, it will give you one false signal after another. Always ask, “What kind of market am I in right now?” before you choose your tool.
4.4. Backtesting is not optional
Would you fly on a plane that had never been tested? Of course not. So why would you risk your money on a strategy you haven’t tested? Use your platform’s features to backtest your indicator strategy on historical data to see its strengths and weaknesses.
View more:
5. A detailed guide: How to trade using indicators
Let’s get practical. Here’s how to use four of the most popular indicators, with a focus on how a real trader would think about their signals.
5.1. The four most popular indicators and how to use them
To kick off your journey into practical indicator usage, we’ll dive into four of the most widely used tools. Each offers unique insights into market behavior, and mastering their application can significantly enhance your trading decisions.
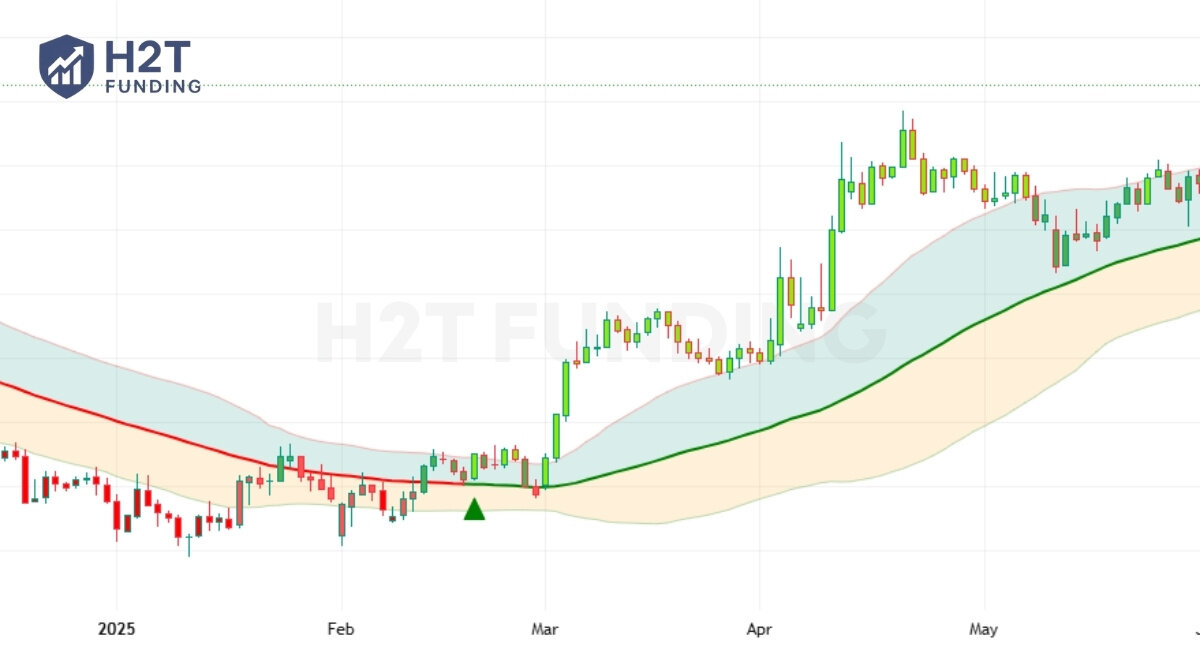
5.1.1. Moving averages (MA): The trend follower
MAs are the foundation of trend analysis. Their function is to filter out short-term price fluctuations, making the underlying trend easier to see. The most common strategy is watching for the price to cross the MA line.
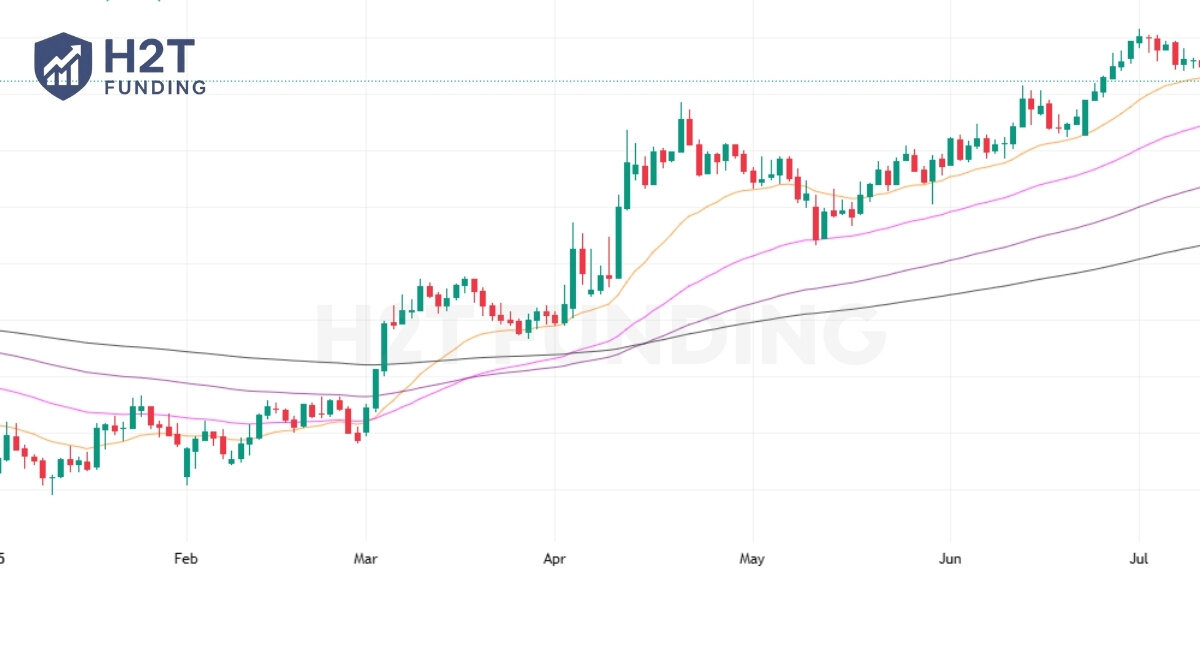
- How it works: Imagine the 50-day MA is your baseline for the medium-term trend. While the price stays above this line, the market sentiment generally remains bullish. Conversely, a decisive cross below the line acts as a warning that the trend’s momentum could be shifting.
- Advanced tip: Watch for the “Golden Cross” (a faster MA, like the 50, crosses above a slower MA, like the 200) as a powerful, long-term bullish signal. The “Death Cross” is the bearish equivalent.
5.1.2. Relative Strength Index (RSI): The momentum gauge
The RSI is an oscillator that measures momentum. It tells you when a move might be running out of steam.
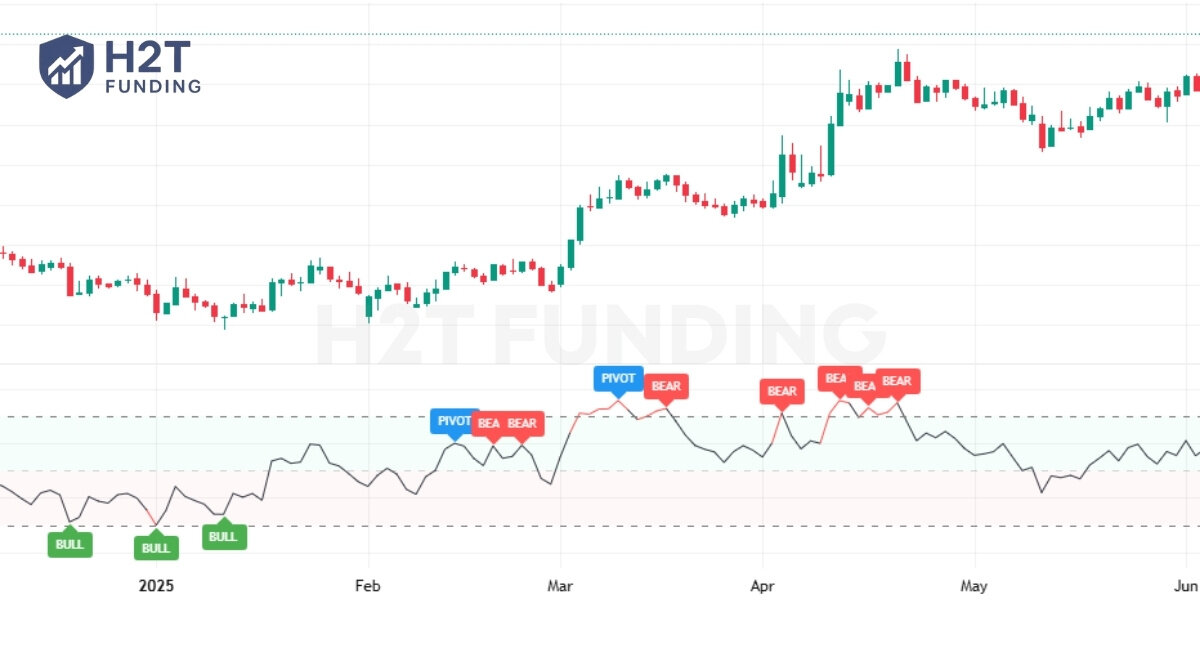
- How it works: The classic interpretation is that a reading above 70 is “overbought” (the buying frenzy might be exhausted) and a reading below 30 is “oversold” (the selling panic might be over).
- Advanced tip: Look for “divergence.” If the price is making a new high, but the RSI is making a lower high, it’s a bearish divergence. This is a powerful signal that the underlying momentum is weakening, and a reversal could be near.
5.1.3. Bollinger Bands: The volatility channel
The distance between the bands is not fixed; they widen during volatile periods and narrow during calm ones. They provide a dynamic channel around the price.
- How it works: The key signal to watch for is the “squeeze.” This happens when the bands constrict, signaling a phase of low volatility that frequently serves as a launchpad for a powerful price breakout.
- Common strategy: A popular tactic in non-trending markets is to use the bands as dynamic levels of support and resistance. Traders might consider selling as the price approaches the upper band and buying as it nears the lower band.
5.1.4. MACD: The trend and momentum hybrid
The MACD is brilliant because it blends trend-following and momentum into one indicator.
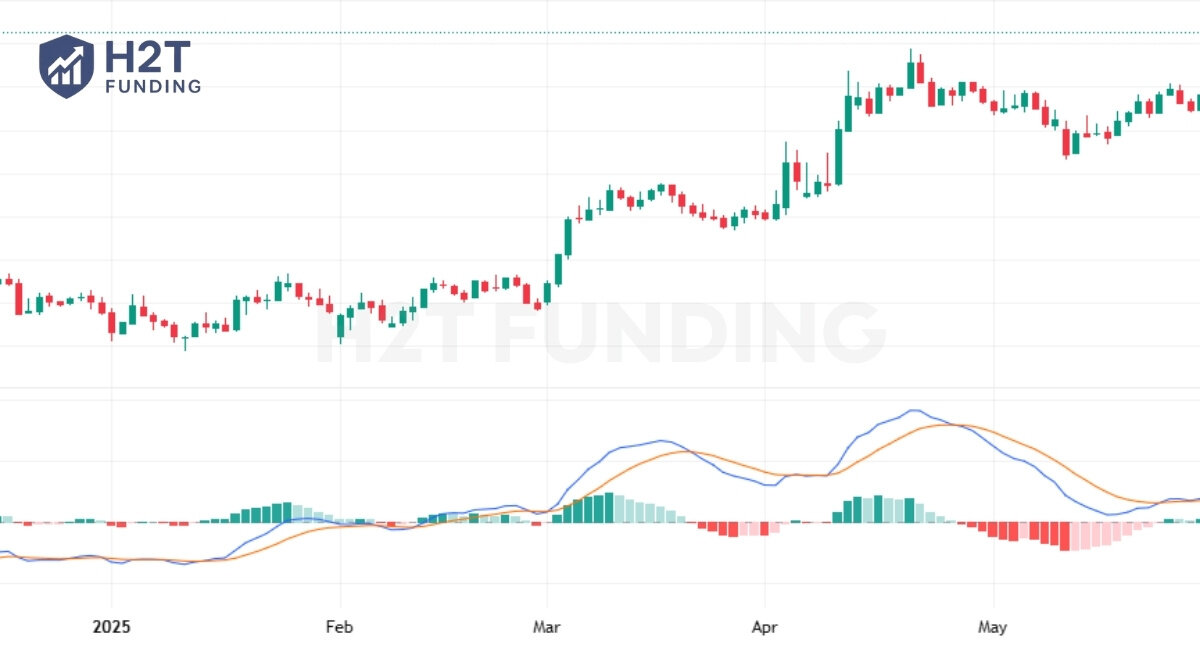
- How it works: The most widely watched event on the MACD is the crossover, which happens when its two moving average lines intersect. When the faster MACD line crosses above the slower Signal line, it’s a bullish signal, and vice versa.
- The histogram: The bars on the MACD histogram show you the difference between the two lines. As the histogram bars get taller, it signals that momentum is strengthening; as they shrink, it suggests momentum is fading.
5.2. The pro strategy: Combining indicators for confirmation
Remember rule #2? Never trust a single indicator. The key to high-probability trading is confirmation. You want different indicators, from different families, to tell you the same story.
A classic combo: Trend + Momentum.
- The big picture (Trend): Use a 200-period MA to define the overall trend. If the price is above it, you are only looking for buy signals.
- The entry signal (Momentum): Wait for the RSI to dip into oversold territory (e.g., below 30). This is your potential entry zone.
- The trigger: Enter the trade only when the price starts to recover and the RSI crosses back up above 30, confirming that buyers are stepping back in.
6. How to spot a truly useful trading indicator
A genuinely good indicator isn’t about being some mystical tool; it’s about its utility within your specific trading framework. Here’s what makes an indicator stand out:
6.1. It aligns with your strategy
A valuable indicator consistently helps you pinpoint the opportunities your particular trading strategy is designed to capture. It acts as a perfect fit for your plan, rather than a generic solution that creates noise. If an indicator leads to confusion or contradictory signals, it might not be right for your approach.
6.2. It fuels objective decisions
A beneficial indicator should visualize market information clearly and simply. Its purpose is to transform complex data into straightforward signals, helping you make choices based on rules and data, not emotion. A good indicator removes ambiguity, promoting consistent action.
6.3. It enhances your market analysis
No indicator should stand alone. A strong one complements, rather than complicates, your existing market analysis, like price action or market structure. Think of it as an extra layer of insight, offering confirmation or clarification of what you’ve already observed. It’s a tool for validation, bolstering your confidence in a signal.
7. The 5 deadly mistakes to avoid when trading with indicators
While trading indicators offer powerful insights, they can also lead you astray if not used wisely. Be aware of these common pitfalls to maximize their effectiveness and protect your capital.
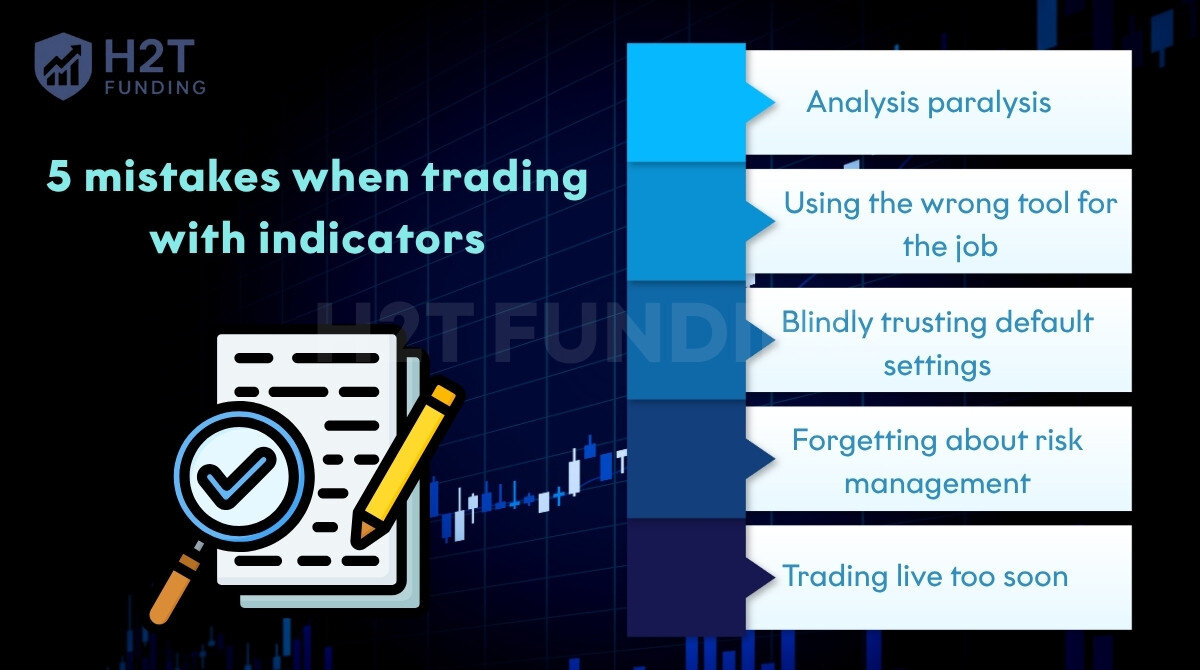
- Analysis paralysis: Don’t be the trader with 10 indicators on your screen. It leads to confusion and inaction. Pick two or three that complement each other and master them.
- Using the wrong tool for the job: Trying to use a trend indicator in a sideways market is like trying to use a screwdriver to hammer a nail. It won’t work.
- Blindly trusting default settings: The default setting (e.g., 14 on the RSI) is a starting point, not a magic number. Test and see what works for your trading style and timeframe.
- Forgetting about risk management: An indicator’s signal offers no information about where to place your stop-loss or how much capital to put at risk. Your risk plan is always more important than your entry signal.
- Trading live too soon: This is a classic rookie mistake. Practice on a demo account until using your indicator strategy feels second nature.
8. Frequently asked questions (FAQ)
Virtually every modern trading platform and charting site (like TradingView or the platform provided by your broker) offers these standard indicators for free as part of their basic toolset.
This is a false choice. The best traders don’t pick one over the other; they use both. Price action is the pure, unfiltered movement on a chart, representing the story of what is happening in the market at this very moment. Indicators are the tools that help you organize, filter, and confirm that story. Learn to make them work together.
For beginners, Moving Averages (MAs) and the Relative Strength Index (RSI) are highly recommended. MAs identify trends, and RSI gauges momentum, providing a solid learning foundation.
Yes, absolutely. Many successful traders rely solely on price action analysis. Indicators can still be valuable for filtering information or confirming those price action signals.
Yes, indicators can be valuable tools for market analysis, helping identify trends and momentum. However, they should complement, not replace, a comprehensive trading plan.
There isn’t a single “best” indicator. The most effective one depends on your specific trading strategy, timeframe, and personal style. It’s about finding what resonates with your approach.
Use indicators to confirm market trends, identify potential entry/exit points, and assess market conditions. It’s best to combine two to three complementary indicators and always practice thoroughly on a demo account before live trading.
The honest answer is: no indicator is profitable on its own. Profitability comes from your trading strategy, your complete set of rules for risk management, position sizing, entries, and exits. The indicator is just the tool that helps you execute that strategy. A better question is, “Which indicator best visualizes the opportunities my trading plan is designed to capture?”
9. Conclusion: Your path to mastering trading indicators
Mastering how to trade using indicators is a journey of practice, observation, and refinement. They are not a magic system for printing money. They are tools that, when understood deeply and used with discipline, can provide an incredible edge by bringing objectivity and clarity to a complex environment.
Remember the key lessons: keep it simple, always seek confirmation, and respect risk above all else. This is how you evolve from someone who just uses indicators into a trader who thinks with them.
To continue your education and explore how our resources can support your growth, we invite you to learn more at the Prop Firm & Trading Strategies of H2T Funding.
If you have any questions about indicators or would like to share your favorite strategies, please leave a comment below. Don’t hesitate to contact us for more detailed support!