To learn how to change candle color on TradingView, simply right-click on your chart, select Settings, and open the Symbol tab. From there, you can easily adjust the body, border, and wick colors to match your personal preference.
A clean, customized chart setup helps traders reduce eye strain and make sharper decisions. Here at H2T Funding, we encourage traders to optimize their workspace before taking on a funding challenge.
Key takeaways
- Right-click anywhere on the chart background or double-click a candlestick to open the customization panel.
- Navigate to the Symbol tab to modify colors for the bodies, borders, and wicks of both bullish and bearish candles.
- If your new colors do not appear, an active indicator might be overwriting your visual settings.
- Knowing exactly how to change candles on TradingView helps you build high-contrast layouts, like a minimalist black-and-white theme.
1. How to change candle color on TradingView: Step-by-step guide
Changing your chart appearance starts by accessing the main customization panel. You can easily adjust the look of your bullish and bearish candles to reduce visual distraction. Here is a quick overview of the exact process before we dive into the details:
- Step 1: Open the menu: Right-click the blank chart grid and select Settings.
- Step 2: Find the right tab: Click on the Symbol tab in the left sidebar.
- Step 3: Pick your shades: Choose new colors for the body, borders, and wicks. Click the OK button to save your changes instantly.
1.1. Step 1: Accessing chart settings
The first step is to open the main settings menu. Make sure you are viewing your charts in the primary window. Right-click anywhere in the blank grid area of your screen. Avoid clicking on any active indicators or drawing tools.
From the pop-up menu, choose the Settings option. Alternatively, if you want to know how to change candlestick color in TradingView faster, just double-click a candle. This shortcut opens the customization panel immediately.
1.2. Step 2: Navigating the Symbol Tab
Once the settings window appears, look at the left sidebar. Select the Symbol tab to access the appearance controls. This specific section holds all the options for adjusting the visual style of your price action.
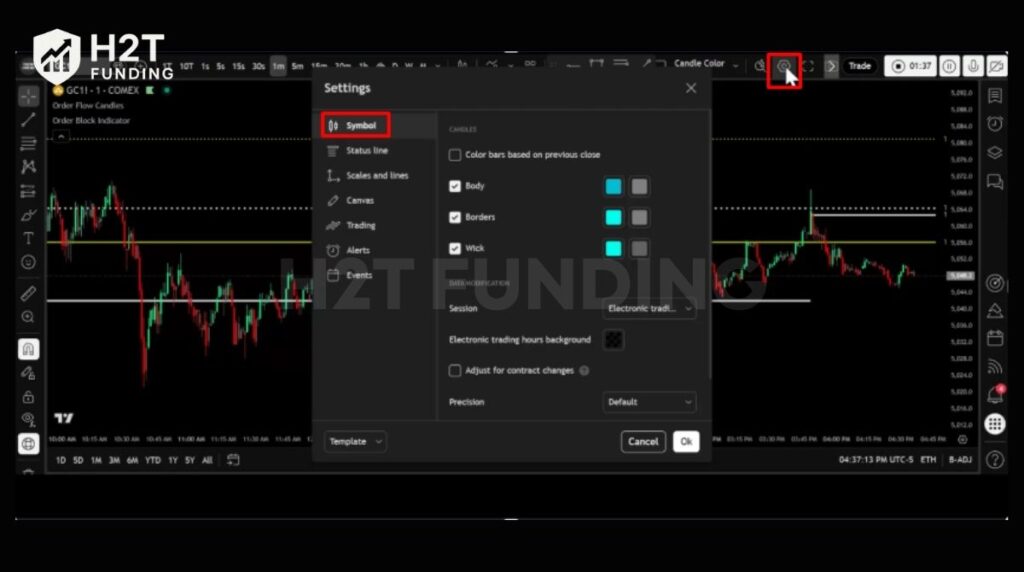
Here, you will see settings dedicated to both bullish and bearish movements, which are crucial when learning how to understand trading charts. Taking your time on this step ensures you find the right features. It is the central hub for all basic chart modifications.
1.3. Step 3: Customizing body, borders, and wicks
Now comes the fun part of updating your layout, which is especially useful once you know how to read candlestick charts. Under the Candles section, you can modify the body, border, and wick settings. Click the color boxes next to each option to pick your preferred shades.
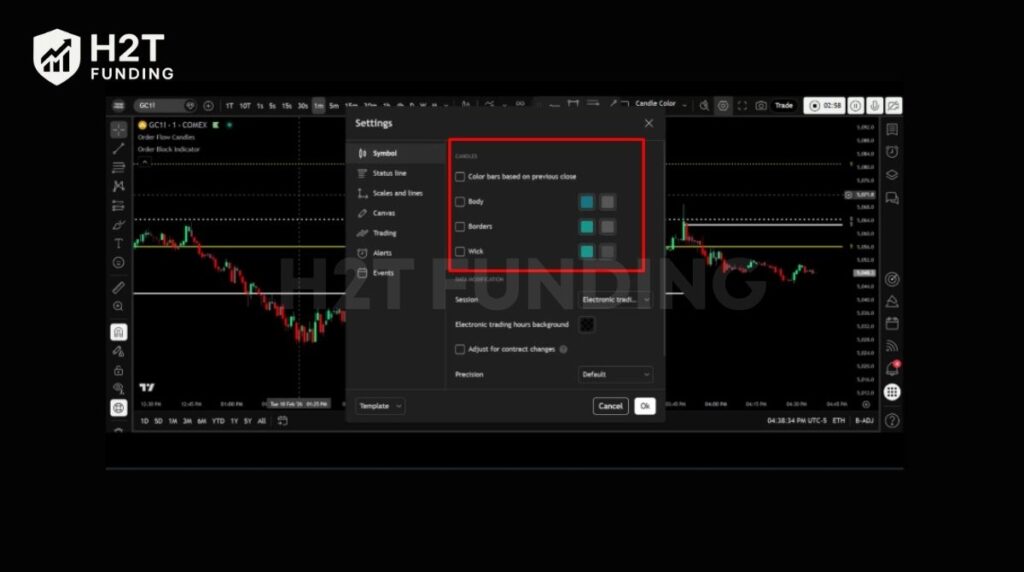
For example, many users switch from the default green and red to crisp white and black. If you are wondering how to change the candle color on TradingView effectively, keeping the borders matching the body is a great start. Once you finish adjusting, simply click OK. Your entire chart will update instantly.
Warning: Always remember to save your chart layout by clicking the cloud icon at the top right. If you close your browser tab without saving, your custom color settings will be lost.
2. How to change candle color in TradingView mobile app
Modifying your chart’s appearance on your phone requires opening the settings menu directly from the main trading screen. The process is completely straightforward and works the same way whether you are using an Apple or an Android device.
2.1. Adjusting settings on Android & iOS
To begin, tap anywhere on the chart grid to bring up the bottom menu, then select the gear icon for Settings. Next, navigate to the Symbol tab, exactly as you would do on the desktop version. Here, you will find the options to adjust the body, borders, and wicks.
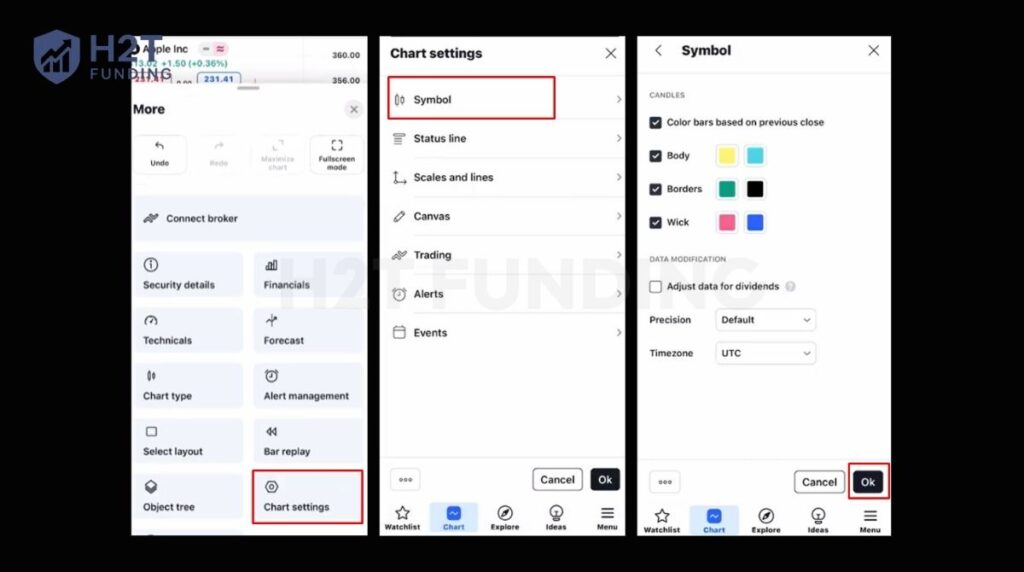
If you are figuring out how to change candle color in TradingView Android or iPhone, rest assured, the interface is identical. Simply tap the color boxes to select your preferred shades for bullish and bearish price movements. Once you finish, tap OK to apply the new style to your screen.
2.2. Syncing layouts across devices
Your custom visual preferences will automatically transfer across all your devices if you properly save your workspace. To do this, simply create and save a new chart layout within the mobile application.
This step ensures your updated design remains consistent when switching from your phone back to your computer. Mastering how to change candlestick color in the TradingView mobile app guarantees that you never lose your customized, high-contrast setup while trading on the go.
Customizing your mobile charts keeps your daily trading experience consistent and completely distraction-free. By adjusting these specific visual settings and saving your layout, you easily maintain a clean, professional setup no matter where you choose to trade.
3. Advanced: How to use indicator candle coloring & pine script
If you are learning how to trade using indicators, you might notice that sometimes your custom settings will not show up because an active indicator or custom code is overwriting your chart. You can easily fix this overlap by understanding how these scripts work.
3.1. How scripts change candle colors with Pine Script
For custom strategies, you can write specific rules to alter candle appearance automatically. TradingView’s Pine Script allows you to highlight certain market conditions without changing your global chart settings.
For example, a simple command like barcolor(color=color.red) will immediately turn the targeted bars red. Traders use this powerful feature to highlight specific trading sessions or complex patterns right on their screen.
3.2. Troubleshooting indicator color conflicts
However, this same feature can cause conflicts when an indicator you added interferes with your manual settings. This usually happens in two ways:
- Color Overrides (Script Settings): This is the most common issue. Most indicators use scripts (like the barcolor function) that completely overwrite your chart’s default colors. To fix this and restore your manual choices, open the indicator’s settings and disable the color override in the Style tab.
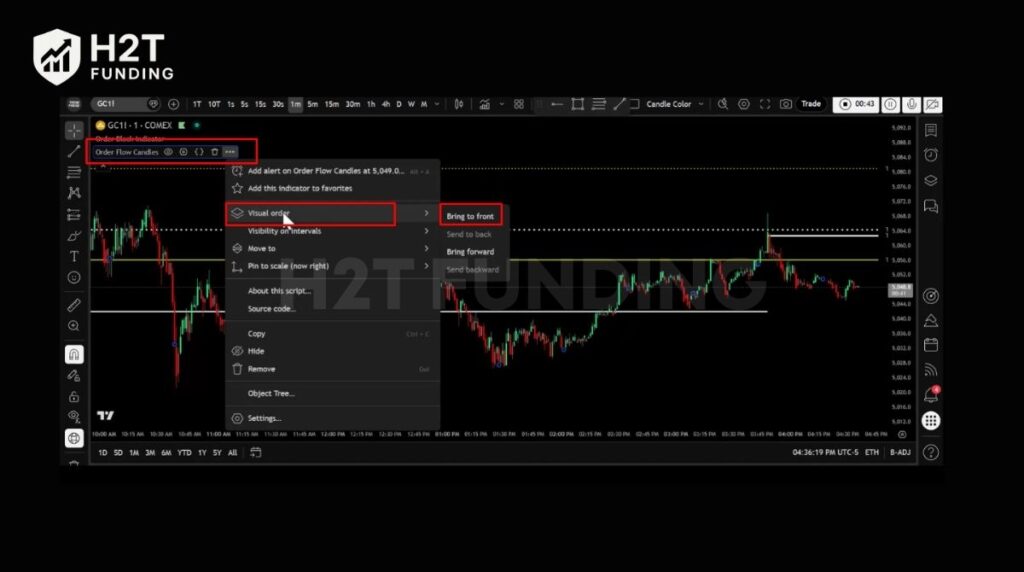
- Layering Issues (Visual Order): This issue is for custom indicators that plot entirely new candles on your screen. If you want to see the indicator’s custom candles but they are hidden, you need to adjust the layer. Click the three dots next to the indicator name, hover over Visual Order, and select Bring to Front.
Mastering both Pine Script settings and visual layers ensures your indicators never mess up your carefully planned layout. By applying these advanced tweaks, you gain complete control over how your trading data is presented, keeping your workspace perfectly optimized.
4. Best TradingView candle colors for funded traders
The best color scheme for your chart is one that minimizes emotional decision-making. For traders aiming to pass funding challenges, a clean, high-contrast layout is a professional tool that supports a disciplined mindset. It helps you focus on pure price action.
4.1. Understanding default chart colors and market implications
Traditionally, bullish candlesticks are green, showing the closing price was higher than the open. Bearish candles are red, indicating the closing price was lower. While intuitive, these colors can have psychological drawbacks.
Many traders find that bright green can sometimes amplify feelings of greed, while red can trigger fear or panic. For a funded trader who needs to remain objective, these emotional responses can be a significant disadvantage. The goal is to analyze the market, not react to it.
4.2. Minimalist setups (Black & White vs. Green & Red)
A simple black and white setup offers a powerful solution. This minimalist approach strips away the emotional impact of bright colors, allowing for a more neutral and analytical view of the market. Knowing how to change the candlestick colors on TradingView to a neutral palette is a key step in professionalizing your workspace.
High-contrast themes offer several advantages:
- Reduced Eye Strain: They are much easier on the eyes during long trading sessions.
- Improved Focus: A cleaner chart removes unnecessary distractions.
- Emotional Neutrality: Black and white do not carry the same psychological weight as green and red.
Ultimately, the best TradingView candle color setup is one that helps you stay calm and focused. A minimalist, high-contrast design encourages the logical, unemotional approach required to trade successfully and consistently under pressure.
5. FAQs
The default color for a bullish candle is green, which shows the price closed higher than it opened. For a bearish candle, the default is red, indicating the price closed lower than its opening price.
This usually happens because an indicator’s script is overwriting your manual settings. To fix it, open the indicator’s settings, go to the Style tab, and disable its custom color override feature.
You can switch the entire platform between a Dark Theme and a Light Theme by clicking the Toggle Theme button. This is usually found in the main menu, providing a quick way to change the overall look.
The workflow is very similar on both platforms. While the user interface might have minor differences, you can find the candle color options in the same Symbol tab within the chart settings on both iPhone and Android.
To change the background color on the mobile app, tap the gear icon to open Settings. Go to the Appearance tab, where you can select a new color for your chart’s background.
To save your new settings permanently, you must save the entire chart layout. Click on the cloud icon at the top right of your chart and select Save. This action preserves all your visual customizations for future use.
To reset your colors, open the Chart settings window and navigate to the Symbol tab. At the bottom of this window, you will find a Template button. Click it and select Apply defaults to restore the original green and red color scheme.
There are two ways to do this in TradingView: The One-Click Method: Go to Chart Settings > Symbol and uncheck the Body box. This instantly removes the fill color, leaving only the borders to create a minimalist hollow effect on your standard candles. Change Chart Type: If you want to use the official Hollow Candle logic (where fill and color depend on the previous close), click the chart type icon on the top toolbar and select Hollow Candles from the dropdown menu.
Yes, you can. In the Symbol tab of the chart settings, there is a checkbox labeled Color bars based on previous close. When you enable this feature, a candle’s color will be determined by whether its close is higher or lower than the prior candle’s close.
To switch your candle type, click the candle icon on the top toolbar of your chart. A dropdown menu will appear with different chart types. Simply select Heikin Ashi from this list to change the chart display.
Click directly on the Volume indicator name at the top-left corner of your chart. A small menu will appear. Select the Settings (gear) icon from this menu to open a new window where you can adjust the colors for growing and falling volume bars.
6. Conclusion
Mastering how to change candle color on TradingView is a simple yet powerful step toward creating a professional trading environment. Whether on desktop or mobile, you can easily adjust your chart’s appearance to reduce eye strain and eliminate emotional distractions.
This level of customization allows you to build a clean workspace focused purely on price action, which is essential for maintaining discipline.
A clear and logical approach to the markets is key to success. Now that your charts are optimized, you are better equipped for the next step in your trading journey. You can prove your skills by taking on a funding challenge or continue sharpening your edge by exploring H2T Funding‘s expert insights in the Prop Firm & Trading Strategies section.