Experiencing an issue on TopstepX why are my 2 charts mirroring together? You’re not alone, and the good news is this isn’t a bug; it’s a built-in feature called Symbol Link that’s currently active.
In this guide, I’ll walk you through how to disable it and regain control of your individual charts in under a minute. This is a fast, simple fix that offers immediate reassurance.
Key takeaways:
- Chart mirroring in TopstepX is caused by the Symbol Link feature, which syncs charts using the same symbol group color, useful for multi-timeframe analysis but confusing when enabled unintentionally.
- You can easily fix chart mirroring by locating the link icon, changing its color group, or setting it to gray to unlink the charts entirely.
- This process takes less than a minute and allows full control over each chart, ensuring they operate independently as needed.
- Symbol Link can be a powerful tool when used intentionally, letting traders streamline workflow across multiple charts of the same instrument.
- If syncing persists after unlinking, ensure all relevant components are properly ungrouped and consider restarting the platform to clear any glitches.
1. TopStepX why are my 2 charts mirroring together?
Your charts are mirroring because they are intentionally connected by the Symbol Link feature. This powerful tool links multiple chart windows to the same trading symbol: when you change the symbol on one chart, it automatically updates all linked charts.

This feature exists to enhance trading efficiency, ideal when monitoring the same instrument across different timeframes. For example, you may have ES (E‑Mini S&P 500) on a 5‑minute chart and also on a 1‑hour chart.
If you decide to switch your analysis to NQ (Nasdaq 100), changing the symbol on one chart cascades the change to the other. However, if activated by accident, it can make your charts appear to be “mirroring” unintentionally.
By understanding the purpose behind Symbol Link, you’ll see how easily this mirroring can sneak into your workflow, and how simple it is to fix.
Discover more: Consistency rule on Topstep Express Account explained
2. How to fix TopstepX chart mirroring in 3 simple steps
If your TopstepX charts are mirroring each other and you want them to operate independently, the solution is easier than it sounds. The issue stems from a feature that can be toggled off in just a few clicks.
Let’s go through the process step-by-step to fix this syncing behavior and get your charts working exactly how you want.
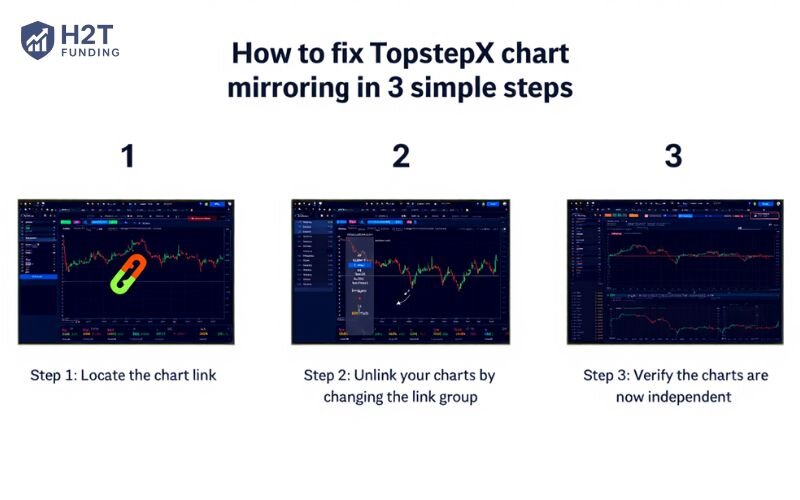
2.1. Step 1: Locate the chart link icon
The first thing you need to do is identify the Symbol Link icon on your charts. This icon typically appears in the top-left corner of each chart window as a small colored square or a chain link symbol.
The color of the square matters: charts with the same color are linked and will mirror one another. If you see both charts using, for example, a blue icon, that’s a clear sign they’re grouped and syncing automatically.
Once you’ve located this icon, you’re ready to unlink your charts and stop them from syncing in the next step.
2.2. Step 2: Unlink your charts by changing the link group
Now that you’ve identified the Symbol Link icon, it’s time to break the connection between your charts. By changing the link group, or removing it entirely, you can stop charts from mirroring each other. The process is quick and requires only a few clicks.
Here’s how to do it:
- Click the colored Symbol Link icon on one of the charts you want to unlink.
- A dropdown menu with color options will appear.
- Select the gray square from the palette. Gray represents an unlinked chart.
- Alternatively, assign a different color to each chart (e.g., Blue for one, Orange for the other) if you still want them grouped, but separately.
2.3. Step 3: Verify the charts are now independent
After unlinking your charts, it’s important to make sure the changes have taken effect. This step confirms that your adjustments worked and your charts will no longer mirror each other unintentionally.
To verify:
Change the instrument symbol on one of the charts, for example, switch from “ES” to “NQ.” Then, check the second chart. If it remains on “ES” and does not update automatically, you’ve successfully unlinked the two charts. Your TopstepX mirroring issue is now resolved.
This simple verification ensures your trading layout behaves exactly how you want, with no accidental syncing and no distractions.
Read more:
3. Pro-tip: When should you use the chart linking feature?
While the chart mirroring issue on TopstepX may have caused confusion, the Symbol Link feature is actually a powerful tool when used intentionally. It’s designed to help traders analyze the same instrument across multiple timeframes without repetitive manual input.
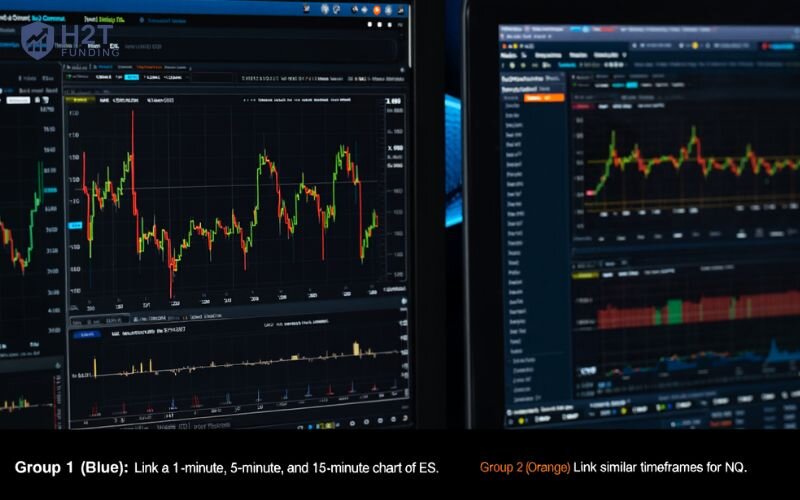
For example, imagine you’re actively monitoring both ES and NQ futures contracts:
- Group 1 (Blue): Link a 1-minute, 5-minute, and 15-minute chart of ES.
- Group 2 (Orange): Link similar timeframes for NQ.
This setup allows you to switch all three ES charts to Crude Oil (CL), Gold (GC), or any other symbol just by changing the symbol on one of the Blue group charts. It’s an efficient system for multi-timeframe traders who rely on speed and clarity.
So while it may cause a TopstepX dual chart issue when used accidentally, this feature becomes a powerful asset once you understand how and when to apply it.
Continue reading: How much are market data fee for Top Step? Costs explained
4. Frequently asked questions (FAQs)
Click the “Layout” or “Grid” icon on TopstepX to choose a chart layout like 2×1 or 2×2. Load a different instrument into each window. Use the Symbol Link tool to group charts as needed or leave them unlinked for full control.
If your charts continue to sync after you’ve unlinked them, the most common reason is that another element in your workspace is still part of the same color group. Check to make sure that all elements you want to be independent are set to the gray (unlinked) group. If the issue persists, a simple restart of the TopstepX platform often resolves any minor display glitches.
No, TopstepX only supports linking charts by symbol. Timeframes must be set manually for each chart, even if they’re linked by the same instrument.
5. Conclusion
Still wondering TopstepX why are my 2 charts mirroring together?, The answer lies in the Symbol Link feature, helpful when used intentionally, but frustrating when accidentally enabled.
Fortunately, fixing it takes less than a minute by unlinking or changing the link group. Once done, you’ll have full control over how each chart behaves.
Want to trade smarter, not harder? Don’t stop here, explore H2T Funding‘s tutorials, trading strategy breakdowns, and platform fixes inside the Prop Firm & Trading Strategies section. Whether you’re navigating TopstepX or comparing firms, we’ve got the insights to keep you ahead.