Have you ever looked at a price chart and felt like you were just staring at random, chaotic lines? What if you had a map to help you identify potential turning points where you could buy or sell? That map is precisely what you get when you understand support and resistance.
This concept is one of the most fundamental pillars of technical analysis. It helps you read the market’s story by showing you where the balance of power between buyers and sellers might shift.
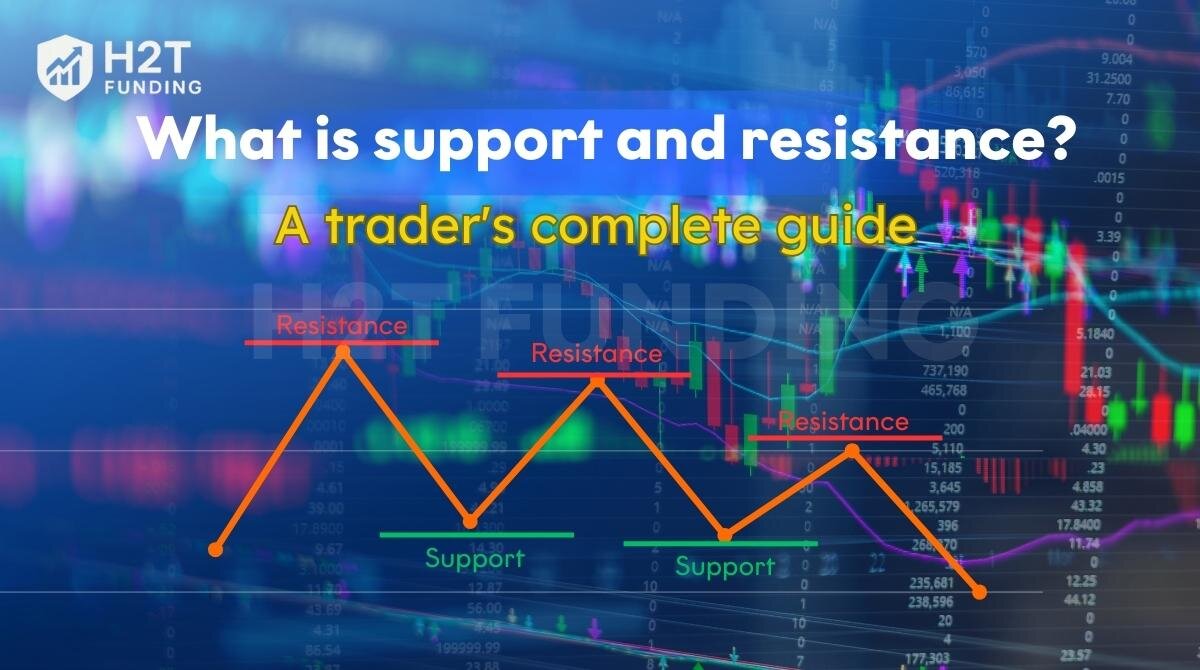
So, what is support and resistance in trading? In the simplest terms, think of support as a price “floor” that stops an asset from falling further, and resistance as a “ceiling” that prevents it from rising higher.
H2T Funding’s guide will take you from the basic definition to the practical strategies you can use in your trading today, filled with lessons I’ve learned over the years of watching the charts. And if you’re just starting, check out this guide on the best trading strategy for beginners for a strong foundation.
Key takeaways:
- What is support and resistance? Support is a price “floor” (where buyers defend), while resistance is a price “ceiling” (where sellers create a barrier).
- How to identify: Use historical peaks/troughs, trend lines, moving averages, and higher timeframes.
- Role reversal: When a level is broken, it often reverses its role (old resistance becomes new support).
- Trading strategy: There are three main ways to trade: range trading, breakout trading, and pullback trading.
- Safety rules: Always treat levels as zones, confirm with volume, and look for confluence from multiple factors.
1. What is support and resistance? How do you define support and resistance?
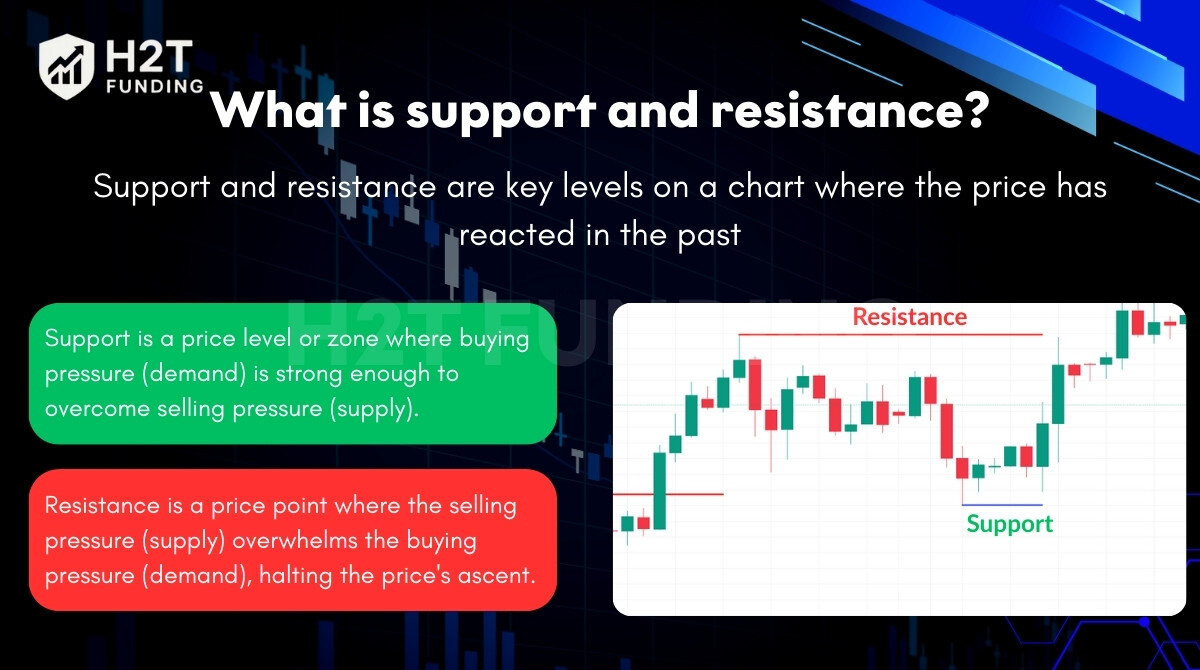
At its heart, support and resistance are key levels on a chart where the price has reacted in the past. These reactions are driven by the raw, human emotions of supply and demand.
1.1 Support: The price zone where buyers mount a defense
Support is a price level or zone where buying pressure (demand) is strong enough to overcome selling pressure (supply). This halts a price decline and often causes the price to bounce back up.
So, what’s actually happening inside traders’ heads at a support level? It’s a mix of two powerful emotions: regret and opportunity. Traders who hesitated and missed the last rally see this as their second chance to get in. At the same time, traders who were shorting the asset start getting nervous and buy to cover their positions. This combination creates a powerful wave of demand.
For example, imagine a stock drops from $120 to $100 after some bad news. It quickly bounces back as buyers jump in. After several attempts, the price repeatedly fails to drop below the $100 mark, confirming it as a strong support zone.
1.2 Resistance: The price zone where sellers create a barrier
Resistance is the opposite. Here, the selling pressure (supply) overwhelms the buying pressure (demand), halting the price’s ascent.
Here, the psychology is driven by profit-taking and the belief that the price is “too high.” Traders who bought low are now happy to sell. Others who believe the asset is overvalued see this as a perfect opportunity to open short positions, increasing the selling supply.
For example, let’s say a stock has been rising but repeatedly fails to break above $75. Each time it gets close to that price, a wave of sellers appears, pushing the price back down. This repeated failure to climb past $75 makes it a strong resistance zone.
The golden rule: draw zones, not single lines
A common mistake new traders make is drawing support and resistance as razor-thin, single lines. The market is not that precise. Prices can, and often do, poke slightly through a level before reversing.
To avoid getting stopped out by these “whipsaws,” it is crucial to think in terms of support and resistance zones. Draw your support or resistance area to cover the key candle wicks and bodies, creating a buffer that better reflects the market’s real-world messiness.
1.3. How do you define support and resistance?
For me, the simplest way to define support and resistance is to see them as the market’s collective memory. They aren’t just lines on a chart; they’re the invisible story of where traders have collectively decided a price was either a great bargain or way too high.
Support is a price level where buyers, as a group, seem to remember a good deal. It’s where enough people feel confident about the value to step in, creating a floor that’s hard to break.
Resistance is the exact opposite. It’s a point where sellers remember a price being “too high,” and they eagerly jump in to take profits or start selling, creating a ceiling that’s difficult to climb through.
Ultimately, these levels tell a powerful story of fear and greed, showing us where the market has found its emotional balance in the past. To me, that’s their true value.
2. Types of support and resistance
Support and resistance aren’t all the same. Understanding these different types of what is resistance and support is key to a flexible and accurate analysis of any chart.
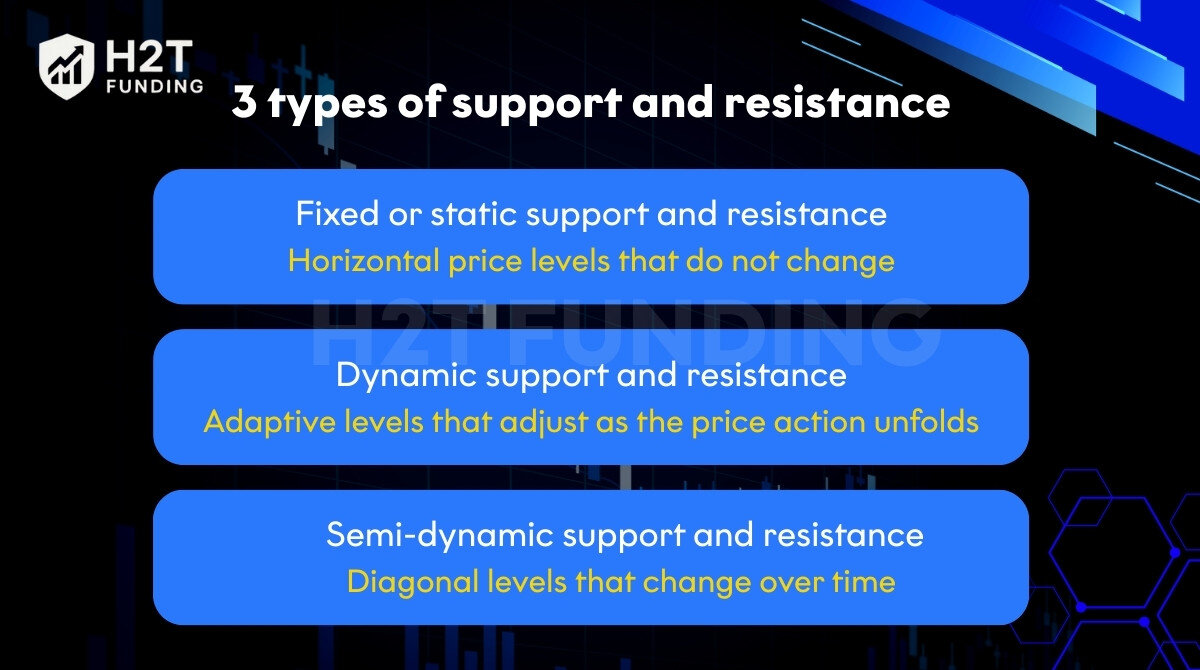
- Fixed or static support and resistance: These are horizontal price levels that do not change. They are the most common type and are based on previous highs and lows or psychological levels (e.g., $100 for a stock).
- Dynamic support and resistance: These are adaptive levels that adjust as the price action unfolds. The most popular examples are moving averages (like the 50-day or 200-day MA).
- Semi-dynamic support and resistance: These are diagonal levels that change over time but are fixed once drawn. The perfect example is trendlines.
3. How to identify support and resistance levels
For me, identifying support and resistance levels is a skill that requires combining multiple tools. Here are four methods I always trust to find the most important “footprints” on the chart.
3.1. Peaks and troughs
This is the simplest and most foundational method. I always start by looking for clear peaks and troughs on the chart. A peak is where the price reached a high and reversed, becoming a potential resistance level.
A trough is where the price dropped to a low and bounced back, becoming a potential support level. These points are like “historical landmarks” that the market has committed to memory.
3.2. Previous timeframes
One of the most important lessons I’ve learned is that not all levels are created equal. I always check previous timeframes (like the daily or weekly chart) to confirm a level’s reliability. A price level that holds on a weekly chart gives me far more confidence than one that only appears on a 15-minute chart.
3.3. Moving averages
I consider moving averages to be a very effective dynamic support or resistance level.
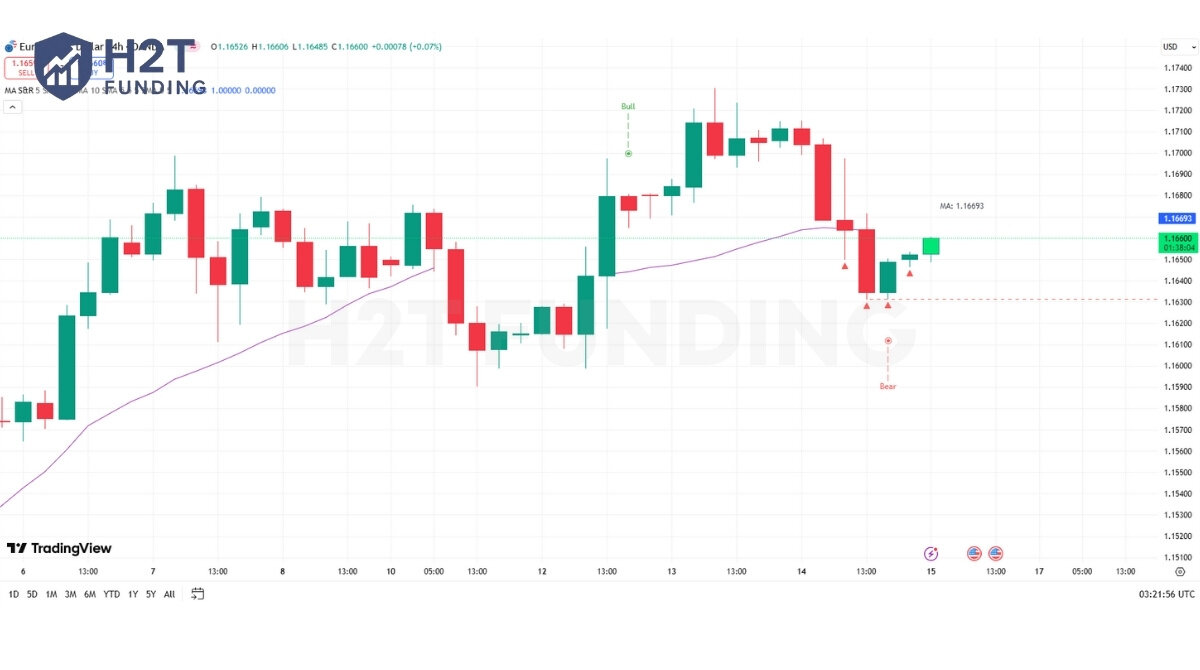
They don’t stand still but move with the price, acting like a dynamic floor or ceiling. When the price is in an uptrend, it often bounces up after touching the moving average (acting as support). Conversely, in a downtrend, the price is often pushed down after touching the line (resistance).
3.4. Trend lines
Just like moving averages, trend lines provide a dynamic boundary for the price. In an uptrend, I connect a series of lows to create a support trend line. In a downtrend, I connect the highs to create a resistance trend line. This line helps me clearly see the “path” that the price is following.
Final Advice: The strongest signals appear when multiple factors point to the same price area. For example, when a previous peak aligns with a moving average and a trend line, that’s an extremely reliable trading level.
Remember that identifying these levels is just one part of the puzzle. To truly succeed, you need to combine this skill with a solid strategy. Learning what is a trading plan is the essential next step to managing your trades and emotions effectively.
4. The aftermath: What happens when a key level finally breaks?
When the price finally pushes through a support or resistance level, it’s a significant event that can signal a major shift in the market.
4.1. Introducing the breakout and the pullback
A breakout happens when the price pushes conclusively past a resistance area or below a support zone, typically accompanied by higher-than-average volume. This indicates that one side, either buyers or sellers, has decisively won the battle for that level.
After a breakout, the price will often return to the level it just broke. This retest is called a pullback. This is the market’s way of validating the new level before continuing in the breakout’s direction. Just make sure you understand what is drawdown in trading to manage risk properly.
4.2. The powerful role reversal principle: A real-world look at Bitcoin
Instead of a generic example, let’s look back at Bitcoin’s chart in late 2020. For months, the $20,000 level was a legendary resistance point; it was the all-time high from 2017 that seemed unbreakable.
When BTC finally broke out past $20,000 in December 2020, the market exploded. But here’s the key part: weeks later, during its bull run, the price pulled back. Where did it find a solid footing? Right around that old $20,000 resistance level.
That ceiling had become the new floor. This is a classic example of role reversal where resistance becomes support, creating a powerful “flip zone” that gives confident traders another chance to get in.
5. How to trade with support and resistance (3 core strategies)
Knowing how to find these levels is one thing; having a clear plan for what is support and resistance trading is another. Here is a simplified support and resistance trading strategy framework with three approaches.
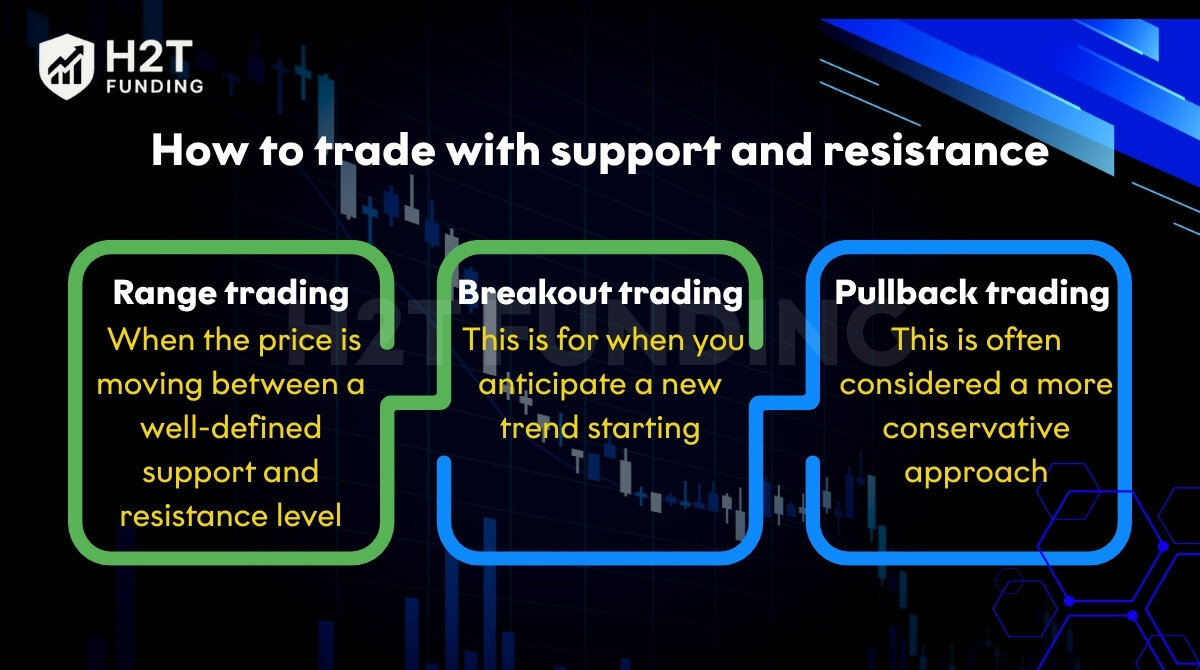
- Range trading (The bounce): When the price is moving between a well-defined support and resistance level, you can buy near support and sell near resistance. This helps you build the habit of buying low and selling high, which is especially useful if you’re looking to pass the FTMO challenge. Position your stop-loss just beyond the zone to protect against a sudden breakout.
- Breakout trading (The break): This is for when you anticipate a new trend starting. You would place a buy order as the price moves above a key resistance area or a sell order as it drops below a crucial support zone.
- Pullback trading (The retest): This is often considered a more conservative approach. Rather than acting on the initial breakout, you allow the price to pull back and retest the level it just conquered. You then enter a trade when the price bounces off that level, confirming the role reversal.
A personal note for beginners: My advice, if you’re just starting, is to please focus on the first strategy: Range trading. It’s the simplest to understand and helps you build the habit of buying low and selling high. I’ve seen too many new traders get burned trying to chase exciting Breakouts, which can often turn into painful “fakeouts.” Master the bounce first, then move on to the break.
6. Hard-learned lessons to keep you safe
Believe me when I say I wish I had known these things when I first started. They would have saved me a lot of money and frustration.
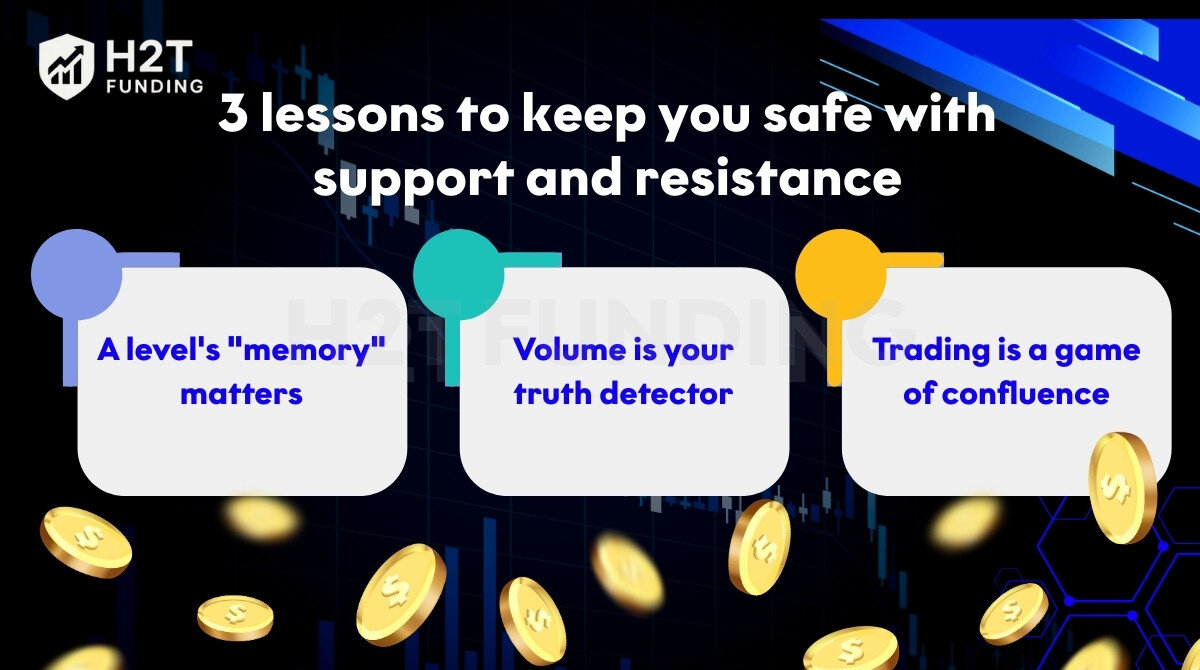
- A Level’s “memory” matters: The longer a level has been respected and the more times it has been tested, the more powerful it is. A weekly support level is a brick wall; a 5-minute support level is just a piece of cardboard. Respect the difference.
- Volume is your truth detector: A breakout without a spike in volume is a lie. I learned this the hard way. It’s often a trap set by big players to lure in retail traders before reversing the price. Always wait for volume confirmation.
And if you’re using funded accounts, tools like FundingPips’ risk management can help protect your capital. And if you’re using funded accounts, tools like FundingPips’ risk management can help protect your capital.
- Trading is a game of confluence: A support level on its own is just a hint. But a support level that lines up perfectly with a 200-day moving average and a 61.8% Fibonacci level? That’s not a suggestion; it’s a powerful signal. Always look for multiple reasons (confluence) to enter a trade.
7. Frequently asked questions (FAQs)
It works on all timeframes. However, levels on higher timeframes (daily, weekly) are far more significant and reliable than levels on lower timeframes (5-minute, 15-minute).
No, it’s not a foolproof system. It is a probabilistic tool that helps you identify high-probability trading setups. Always use proper risk management.
They are very similar concepts. Support and resistance are typically viewed as specific lines or narrow zones, while supply and demand trading focuses on broader zones where a major price imbalance occurs.
Absolutely. Support and resistance a universal concepts based on market psychology, making it applicable to support and resistance in stocks, forex, crypto, and any other market with a price chart.
Three key factors determine a level’s strength: Timeframe: A support or resistance level on a weekly or daily chart is far more significant than one on a 5-minute chart. Number of touches: The more times a level has been tested and held, the stronger and more valid it becomes. Volume: A level where a huge amount of volume was traded in the past is much more important than a level with little activity.
Less is more. A common beginner mistake is to clutter the chart with dozens of minor lines. Start by identifying only the most significant levels on a higher timeframe (like the daily or 4-hour chart). Aim for just 2-3 key support and 2-3 key resistance zones. A clutter-free chart promotes clear decision-making.
Fakeouts are frustrating but can be managed. The key is patience and confirmation. Instead of entering immediately as a level breaks, wait for the candle to close decisively beyond the zone. Furthermore, check for a spike in trading volume that confirms the breakout’s legitimacy. If you do get caught in a fakeout, having a clear stop-loss is your best defense.
8. Conclusion: Your next steps in mastering chart analysis
Understanding what is support and resistance are is not just theory; it’s a foundational skill for reading the language of the market. By identifying these key zones, you can better anticipate price movements, manage risk, and find higher-probability trading opportunities.
Remember the hard-learned lessons: treat them as zones, respect higher timeframes, and always look for confluence. Now, the best way to learn is by doing. Open up your charts and start practicing how to draw these levels. Observe how the price interacts with them in a live market. This hands-on experience is the fastest way to build the confidence and skill you need to succeed.
If you’re ready to explore more strategies and take your trading to the next level, check out our resources on Prop Firm & Trading Strategies, read more on our Blog, or learn more about H2T Funding. If you found this guide helpful, let us know your thoughts in the comments below!

